Since a major role of transpiration is leaf cooling, canopy temperature and its reduction relative to ambient air temperature is an indication of how capable is transpiration in cooling the leaves under a demanding environmental load. The relationships between canopy temperature air temperature and transpiration is not simple, involving atmospheric conditions (vapor pressure deficit, air temperature and wind velocity), soil (mainly available soil moisture) and plant (canopy size, canopy architecture and leaf adjustments to water deficit). These variables were considered when canopy temperature has been used to develop the Crop Water Stress Index (CWSI), which is gaining use in scheduling irrigation in crops.
However, in plant breeding and selection for drought resistance the interest is in finding genotypes that maintain transpiration, gas exchange and therefore a lower canopy temperature as compared with other genotypes under the same field conditions. Relatively lower canopy temperature in drought stressed crop plants indicates a relatively better capacity for taking up soil moisture and for maintaining a relatively better plant water status by various plant, onstitutive or adaptive traits (see Blum, 2009). This capacity, as expressed in relatively lower canopy temperatures, was correlated with final yield under stress or other parameters drought resistance in terms of yield such as various plant yield indices under stress. Canopy temperature was also found to be negatively correlated with relative water content (RWC) across diverse wheat and rice genotypes. Canopy temperature is also affected by the relative amount of desiccated and dead leaf in the canopy and thus it was found to be positively correlated with ‘leaf death score’, which is a visual rating of drought stress in selection work.
Since the initial development of the method by Blum et al. (1982) about 33 studies (by the end of 2010) confirmed the utility of this selection method (see references below).
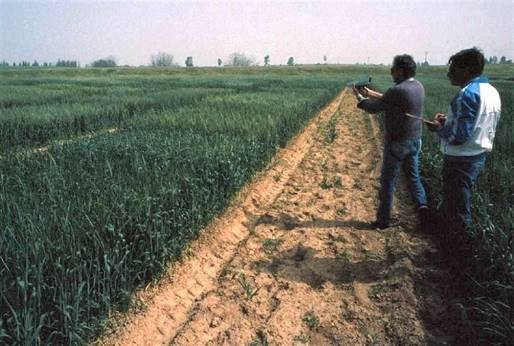 |
The initial development of the method in screening wheat materials for drought resistance at the Volcani Center, Israel. Working: Mr.’s Gil Gozlan & Jacob Mayer (1981). |
Canopy temperature is measured remotely by the infrared thermometer (IRT) (see the detailed theory). Canopies emit long-wave infrared radiation as a function their temperature. The IRT senses this radiation and convert it to an electrical signal, which is displayed as temperature (photo of one of the earlier models). Various instruments are available today from different suppliers: Everest, FLIR, Smartfield etc. Using the thermometer properly is crucial to obtaining reliable data. Following are the most important points in the protocol of using the IRT in breeding nurseries.
- The correlation between canopy temperature and plant water status becomes stronger as plant water status is reduced. Therefore, measurements should be made under well-developed drought stress, typically when most of the materials in the nursery present some leaf wilting or leaf rolling at midday. Measurements should be done at or just after solar noon when plant water deficit is maximized. Since plant water status changes with the march of the day, measurements of the population must be done within about two hours, roughly. If a replicated test is measured, replications should be measured (distributed) along time.
- The thermometer has a fixed angle of view (around 2-5 degrees, depending on the model). The size of the measured target area therefore depends on the distance between the thermometer and the target. The target must consist only of canopy leaves. Any other object in the target area, such as soil surface or inflorscences will result in a temperature reading which does not represent the optimal target, namely leaf canopy. Soil is generally hot and cereal inflorescence is much warmer than leaves because it hardly transpires. Therefore, screening by canopy temperature measurements under drought stress can be done only during the vegetative growth stage, after full ground cover has been attained and prior to inflorescence emergence. In certain large-leaf crops, such as sunflower, maize or sorghum it is difficult to view a canopy made only of leaves. The target area usually consisted of dark areas or stem parts between leaves. These situations do not provide a good option for selection with the IRT, unless the thermometer can view only leaves. A protocol for the selection by measuring individual leaves with the IRT has not been yet established. Considering all of the above, the operator holding the thermometer can manipulate his distance, position and angle with respect to the viewed plot so as to optimize the target view. This position, however, must be maintained with all plots measured.
- Since the assessment of plant stress by canopy temperature within a breeding population is relative, atmospheric conditions during measurements should be relatively stable. Cloudy or windy conditions should be avoided. Especially difficult is transient cloudiness which has an immediate effect on leaf temperature.
- The thermometer should not be exposed to heat unnecessarily, such as letting it lie in the sun. The thermometer can be harmed by direct solar radiation entering its lens. Readings should be made with the sun at the back of the operator, basically similar to the rule in photography. This should be taken into account when the nursery layout is planned.
- The nursery should contain a running check (control) cultivar, every 10 to 100 genotypes, depending on the case. Canopy temperature of the running check provide a basis for assessing site variability and offer a means for normalizing data against this variability.
- Finally, several measurements should be taken during a drying cycle and depending on the data and the stress level the final evaluation can be based on average data or data from a selected date.
Data analysis
The corollary of these measurements in selection work is that the breeder is interested in large differences so that he can reduce the population reliably into the most desirable materials. Experience shows that if work is performed carefully as outlined above, about 10 to 20C can be the least significant difference (at 5%). If stress is sufficient and atmospheric demand for transpiration is high, genotypes may differ by up to 50 to 100C on a given day, depending on the crop and the nature of the population.
For each date of measurements data can be processed in three forms: actual temperatures, temperature of the genotypes as percent of the mean temperature of the block; and temperature of the genotypes as percent of the temperature of the nearest running check. ‘Nearest neighbor’ statistical analysis is also appropriate in this case and it is available as part of some statistical software packages, such as ‘AGRIBASE’ (at http://www.agronomix.mb.ca/).
Remember, no method of data analysis will compensate for failing to observe the correct measurement protocol.
References supporting the method for several field crops (1982-2010)
Blum A. and Pnuel Y. 1990. Physiological Attributes Associated with Drought Resistance of Wheat Cultivars in a Mediterranean Environment. Aust. Jour. Agric. Res. 41:799-810.
Blum A. Mayer J. and Gozlan G. 1982. Infrared thermal sensing of plant canopies as a screening technique for dehydration avoidance in wheat. Field Crops Res. 5:137-146.
Blum A. Shpiler L. Golan G. and Mayer J. 1990. Yield stability and canopy temperature of wheat genotypes under drought stress. Field Crops Res. 22:289-296.
Carolina Saint Pierre , Jose Crossa, Yann Manes and Matthew P. Reynolds. 2010 Gene action of canopy temperature in bread wheat under diverse environments. TAG 120:1107-1117
Fischer K.S. Edmeades G.O. and Johnson E.C. 1989. Selection for the improvement of maize yield under moisture deficits. Field Crops Res.22:227-243.
Franca A. Loi A. and Davies W.J. 1998. Selection of annual ryegrass for adaptation to semi-arid conditions. Eur.J.Agron.9:71-78.
Garrity D.P. and O’Toole J.C. 1995. Selection for reproductive stage drought avoidance in rice, using infrared thermometry. Agron.J.87:773-779.
Hofmann W.C. O’Neill M.K. and Dobrenz A.K. 1984. physiological responses of sorghum hybrids and parental lines to soil moisture stress. Agron.J.76:223-228.
Huang B.R. Fry J. and Wang B. 1998. Water relations and canopy characteristics of tall fescue cultivars during and after drought stress. Hortscience 33:837-840.
Hugues Baimey andMarco Wopereis 2010. Drought resistance in an interspecific backcross population of rice (Oryza spp.) derived from the cross WAB56-104 (O. sativa) × CG14 (O. glaberrima). Plant Sci.179:364-373.
Ingram K.T. Real J.G. Maguling M.A. Obien M.A. and Loresto G.C. 1990. Comparison of Selection Indices to Screen Lowland Rice for Drought Resistance. Euphytica 48:253-260.
J.T. Baker, D.C. Gitz, P. Payton, D.F. Wanjura and D.R. Upchurch 2007. Using Leaf Gas Exchange to Quantify Drought in Cotton Irrigated Based on Canopy Temperature Measurements. Agron. J.99:637-644.
Jefferson P.G. Johnson D.A. and Asay K.H. 1989. Epicuticular wax production, water status and leaf temperature on triticeae grasses of contrasting visible glaucousness. Can.J.Plant Sci.69:513-519.
Juan Jose Olivares-Villegas, Matthew P. Reynolds, and Glenn K. McDonald 2007. Drought-adaptive attributes in the Seri/Babax hexaploid wheat population. Funct.Plant Biol.34:189–203.
Lin Zhu Zong Suo Liang , Xing Xu , Shu Hua Li , Ji Hai Jing and P. Monneveux 2008. Relationships between carbon isotope discrimination and leaf morphophysiological traits in spring-planted spring wheat under drought and salinity stress in Northern China. Aust.J.Agric.Res.59:941–949.
Maria Balota, William A. Payne, Steven R. Evett and Troy R. Peters 2008. Morphological and Physiological Traits Associated with Canopy Temperature Depression in Three Closely Related Wheat Lines. Crop Sci.48:1897-1910.
Marta S. Lopes and Matthew P. Reynolds 2010. Partitioning of assimilates to deeper roots is associated with cooler canopies and increased yield under drought in wheat. Funct.Plant Biol.37:147–156.
McKinney N.V. Schapaugh and W.T. Kanemasu E.T. 1989. Canopy temperature, seed yield, and vapor pressure deficit relationships in soybean. Crop Sci.29:1038-1041.
McKinney N.V. Schapaugh W.T. and Kanemasu E.T. 1989. Selection for canopy temperature differential in six populations of soybean. Crop Sci.29:255-259.
Pantuwan G. Fukai S. Cooper M. Rajatasereekul S. and O’Toole J.C. 2002. Yield response of rice (Oryza sativa L.) genotypes to different types of drought under rainfed lowlands – Part 3. Plant factors contributing to drought resistance. Field Crop Res.73:181-200.
Pinter P.J. Zipoli G. Reginato R.J. Jackson R.D. Idso S.B. and Hofman J.P. 1990. Canopy Temperature As an Indicator of Differential Water Use and Yield Performance Among Wheat Cultivars. Agric.Water Manag.18:35-48.
- Suzuky Pinto, Matthew P. Reynolds, Ky L. Mathews, C. Lynne McIntyre, Juan-Jose Olivares-Villegas and Scott C. Chapman 2010. Heat and drought adaptive QTL in a wheatpopulation designed to minimize confounding agronomic effects. TAG 121:1001-1021.
Rao N.K.S. Bhatt R.M. and Sadashiva A.T. 2001. Tolerance to water stress in tomato cultivars Photosynthetica 38:465-467.
Raskin I. Ladyman, and Juanita A.R. 1988. Isolation and characterization of a barley mutant with abscisic-acid-insensitive stomata. Planta 173:73-78.
Sanchez F.J. Manzanares M. de Andres E.F. Tenorio J.L. and Ayerbe L. 2001. Residual transpiration rate, epicuticular wax load and leaf colour of pea plants in drought conditions. Influence on harvest index and canopy temperature. Eur.J.Agron.15:57-70.
Sanguineti M.C. Tuberosa R. Landi P. Salvi S. Maccaferri M. Casarini E. and Conti S. 1999. QTL analysis of drought related traits and grain yield in relation to genetic variation for leaf abscisic acid concentration in field-grown maize. J.Exp.Bot.50:1289-1297.
Saranga Y., Jiang C.X., Wright R.J., Yakir D., and Paterson A.H. 2004. Genetic dissection of cotton physiological responses to arid conditions and their inter-relationships with productivity. Plant Cell Environ.27:263-277.
Singh D.P. Chaudhary B.D. Phool Singh Sharma H.C. and Karwasra S.P.S. 1990. Drought tolerance in oilseed brassicas and chickpea. Haryana Agricultural Univ. Hisar, p.60.
Singh D.P. Singh P. Kumar A. and Sharma H.C. 1985. transpirational cooling as a screening technique for drought tolerance in oil seed brassicas. Ann.Bot.56:815-820.
Stark J.C. Pavek J.J. Mccann I.R. 1991 Using Canopy Temperature Measurements to Evaluate Drought Tolerance of Potato Genotypes. J.Am.Soc.Hort.Sci.116:412-415
Turner N.C. O’Toole J.C. Cruz R.T. Manuco O.S. and Ahmad S. 1986. response of seven diverse rice cultivars to water deficit. I. stress development canopy temperature leaf rolling and growth. Field Crops Res.13:257-272.
Warren K. Coleman 2008. Evaluation of wild Solanum species for drought resistance 1. Solanum gandarillasii Cardenas. Environ.Expl.Bot.62:221-230.
Winter S.R. Musick J.T. and Porter K.B. 1988. Evaluation of screening techniques for breeding drought resistant winter wheat. Crop Sci.28:512-516.