Drought (and extreme temperature) is an environmental occurrence that can be defined and measured by indices derived from large historical databases on precipitation and other weather variables. Several drought indices are in use, as published by the Drought Mitigation Center at the University of Nebraska. Among these, the ‘Palmer Index’ seems to be widely adopted among climatologists. Information on identification and assessment of drought prone environments can be obtained from various world/country climatic maps available on the net (see ‘Selected Climate and Drought Links’ on this page). See an example of how some of the atmospheric and soil indices are used to describe drought conditions in Georgia (USA).
Geographical Information Systems (GIS) developed very fast and exciting applications useful for agronomists and environmental scientists are being developed. Even CGIAR now specifically addresses the climate challenge in agriculture development. A lightweight GIS data viewer developed by ESRI (“ArcExplorer”) is now available online. This freely downloadable software offers an easy way to perform basic GIS functions. ArcExplorer is used for a variety of display, query, and data retrieval applications and supports a wide variety of standard data sources. It can be used on its own with local data sets or as a client to Internet data and map servers. GIS interfaced with GPS and climatic data now used in precision agriculture and similar map-based applications. Finally, a free online climate estimator for any point on the globe is available and can be a very useful tool for the agronomist and breeder. See LocClim. A downloadable version is available for using this software offline.
Crop simulation models can reasonably estimate and quantify the impact of specific drought stress conditions on crop productivity. Such models require the input of various water regime and climate variables in order to simulate crop yield with better or lesser level of accuracy.
Crop models and user’s guides are available today for:
- Cereals – maize, wheat, rice, sorghum, barley, and millet.
- Grain legumes – soybean, peanut, dry bean, and chickpea.
- Root crops – cassava and potato.
- Sugarcane, tomato, sunflower and pasture.
- And more.
Additional information on crop simulation models and ecological models can be found at Ecobas.
The development of plant water deficit
Plant water deficit develops as its demand exceeds the supply of water. The supply is determined by the amount of water held in the soil to the depth of the crop root system. The demand for water is set by plant transpiration rate or crop evapotranspiration, which includes both plant transpiration and soil evaporation. Evapotranspiration is driven by the crop environment as well as major crop attributes such as plant architecture, leaf area and plant development. The plant functions within a physical system consisting of the soil-plant-atmosphere continuum. During the day the plant is under heavy energy load consisting mainly of the received solar radiation, ambient air temperature and humidity (VPD). While a fraction of this radiation energy is important for photosynthesis (photosynthetically active radiation), most of the total received radiation is not utilized and it must be dissipated. It is partly dissipated by radiation emitted from the plant in the form of heat, but most of it must be dissipated by transpiration. Henceforth the term “transpirational cooling” was coined. Transpiration cause leaves to cool relative to ambient temperature when the environmental energy load on the plant is high. If it were not for transpiration, leaves could be heated to killing temperatures.
Water is driven through the plant from the soil to the atmosphere by the difference in water potential between the atmosphere (very low potential) and the soil (relatively high potential when wet), analogous to the flow of electrical current under the differences in electric potentials (‘Ohm’s law’). Flow is also influenced by hydraulic resistances in the plant, such as the resistance regulated by stomata in the leaves or by the conductive system (root and stem xylem elements) of the plant, or by the resistance of cells and cell walls between soil and the root xylem vessel. Even cellular membranes can regulate the flow of water through the membrane by embedded proteins known as aquaporins.
As water transpires from the leaf, leaf water potential (LWP) is reduced (becoming more negative) (Fig.1). If water is available in the soil (at high soil water potential) then water will flow into the leaf to replenish the loss with only a small reduction in LWP. As soil water potential (SWP) is reduced LWP must be further reduced in order to create the necessary gradient differential (“pull”), which would drive the water up from the drying soil to the leaf.
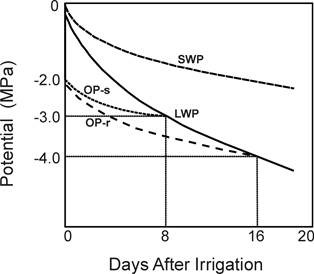
The leaf cells contain various organic and inorganic solutes, which determine the leaf osmotic potential (OP). OP is lower (more negative) than LWP and the difference between the two is turgor potential. Turgor is lost (null value) when LWP=OP (in Fig.1, at about –3.0 or -4.0 MPa on days 8 and 16, respectively – see below for further explanation).
Leaf turgor is associated with cellular growth and function. When turgor becomes null cells collapse and the leaf wilts, though it is not dead. Stomata are responsive (among other factors) to turgor, closing to reduce transpiration. The reduction in stomatal conductance causes also a reduction CO2 fixation and photosynthetic assimilation and an increase in leaf temperature. The increased leaf temperature may reach a level causing heat damage to the leaf especially under hot conditions.
Turgor maintenance and transpiration are therefore crucial to plants under drought stress. Turgor can be sustained by keeping a high LWP through water uptake from the drying soil or by reducing OP through cellular solute accumulation (which is defined as “osmotic adjustment”). In Fig.1 OP-s represents a variety with little osmotic adjustment (OA), where turgor is lost at a LWP of –3.0 MP on day 8, as compare with variety OP-r where due to its greater capacity for OA turgor is lost only on day 16 at LWP of -4.0 Mpa. Hence, OA delays turgor loss and wilting. Further details on OA are given in the Drought Mitigation/Drought Resistance page on this section.
Turgor can also be maintained by cell wall hardening during the development of water deficit. While cell wall hardening helps to sustain turgor it impedes cell growth. This is only one of the many examples where the maintenance of plant water status under drought stress might partly be achieved at the cost of reduced growth.
Besides the factors controlling transpiration at the single leaf level, a most dominant factor in controlling whole plant and crop transpiration is total leaf area. When grown in a pot a large plant will require irrigation more frequently than a smaller one for the same pot volume. A major avenue by which plant evolution served to adapt plants to dry environments is by reduced plant size and growth rate, typical of many xerophytic plants. It is also a common observation that when sever water deficit develops lower (older) leaves are desiccated and die first so as to reduce leaf area and water requirement, while upper (younger) leaves retain open stomata and carbon assimilation.
At the crop level plant size and the demand for water is mainly expressed by leaf area index (LAI), which is the total area of live leaves per unit ground surface (m-2m-2). Crop evapotranspiration (ET) increases with LAI until LAI reaches a maximum threshold beyond which ET does not increase. As the crop matures and leaves senesce, LAI is reduced and so does ET.
Cellular turgor is not the only important transducer of whole plant water stress. The growth regulating hormone abscisic acid (ABA) is produced in the shoot in response to desiccation, causing many of the known expressions and consequences of plant water deficit such as arrested growth, stomatal closure, and reproductive failure. ABA is also produced in the root in direct response to the drying soil and its hardness as it dries (e.g. #8058). ABA flows with the transpiration stream to the shoot. Since the soil may dry around only some of the roots (typically in the top-soil) while most roots are in wet soil, root ABA exported to the shoot may cause stomatal closure or arrested growth before any water deficit develops in the shoot. This “hormonal or chemical root signal” may therefore serve as an “early warning system” to the plant. The function and value of this “root signal” in a crop plant subjected to drought stress has not yet been fully resolved. Without entering a long review and discussion it can be postulated that low ABA production or low shoot sensitivity to ABA might be beneficial in most cases of a crop in an agricultural ecosystem.
The overall agronomic role of ABA is still under debate and unresolved. In the evolutionary sense it may well serve as a major signal to place the plant in a dormant and a life conserving state before it enters sever desiccation.
Measuring plant water stress and water status
Sensing and estimating plant stress at the whole crop level in the field is difficult mainly because of the need to integrate an estimate based on the whole canopy. Remote sensing technology enabled to develop the Crop Water Stress Index (CWSI) already in 1982. This index is developed mainly from measuring the canopy temperature with an infrared thermometer. Infrared remote measurement of leaf temperature is based on a relationship between leaf temperature and transpiration. Generally, as transpiration rate is reduced due to plant water deficit so does leaf temperature rises relative to air temperature. CWSI is mainly applied to irrigation scheduling, but can be applied to non-irrigated conditions. However, basic infrared thermometry in terms of canopy temperature differences among genotypes is used in phenotyping and selection work towards breeding for drought resistance. See under Mitigation/ Methods of Breeding for Resistance.
Several direct measurements can be performed on single plants and leaves in order to assess their water status, stress status, the repercussions of water deficit and its physiological consequences. Here only the most essential and widely used measures of plant water status are mentioned. For additional information check our Methods page. For technical data check the instruments and materials section in the Web Resources Page.
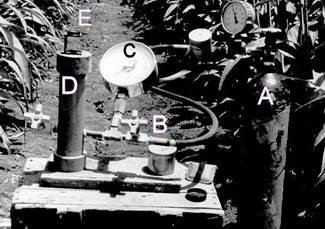
Leaf water potential (LWP) can be measured in detached leaves or tissues by quickly sampling the leaves and putting the sample into the measuring instrument. Measurement can be done by the pressure chamber (Fig.2), which is suitable also for fieldwork. When a leaf (or a stem) is cut off a plant, the sap is sucked back into the xylem, since it is under tension. That tension is broadly equal to LWP. The detached leaf is therefore sealed in a steel chamber with only the cut end protruding out. Pressure is applied to the chamber (from a pressure source such as a compressed nitrogen gas). When the sap meniscus appears at the xylem surface the pressure is recorded and taken as the xylem (leaf water) potential. Typical LWP of live transpiring leaves can range from about -0.3 MPa to –2.5 MPa.
The thermocouple psychrometer is a more elaborate method that is more suitable for lab conditions. The instrument was initially built by the scientists themselves until commercial systems were put on the market. With the basic design the tissue sample is sealed in a small chamber containing a thermocouple. After an equilibration period a cooling current is applied to the thermocouple in order to condense water on the junction. The amount of condensed water is proportional to the water potential of the tissue. That water is allowed to evaporate causing a change in the thermocouple output. That output is calibrated for water potential, using salt solutions. The method has been adapted also to measurement in situ by attaching a specially designed sensor to the leaf. The In situ psychrometric method did not receive wide adoption as compared with other methods.
The pressure probe for measuring turgor pressure is restricted to work with singular cells. With this method a small capillary tube filled with oil is used to puncture a cell. The oil is pushed back into the tube in proportion to the cellular turgor pressure. Applying and measuring a balancing pressure to the probe estimate pressure.
Relative water content (RWC) is a veteran method that has recently gained favour over LWP as a very relevant physiological measure of plant water deficit. Its advantage is that it accounts also for the effect of OA in affecting plant water status. Two plants with the same LWP can have different RWC if they differ for OA. The detailed protocol for RWC is available on this site.
Osmotic potential (OP) is determined in freeze-thawed killed tissue, which serves to release all cellular solutes. The potential recorded in such a sample by the thermocouple psychrometer is OP. Alternatively if a drop of solute can be obtained by squeezing the killed tissue or by centrifugation then it can be measured for OP with a standard (micro) osmometer. Turgor is estimated as the difference between LWP and OP. Turgor is null when LWP=OP (Fig.1). When turgor estimates are required both LWP and OP should best be measured by the same technique, for example with the thermocouple psychrometer.
Osmotic adjustment (OA) is defined as the net accumulation of solutes after the plant has been exposed to a predetermined rate of water deficit. The reduction in OP during water deficit is not an estimate of OA because it is caused by both cellular water loss (a mere concentration effect) and real cellular solute accumulation (OA). OP is measured in the tissue of a tressed plant and OA is calculated as the difference between measured OP and OP estimated for a non-stressed fully turgid state. Alternatively, water deficit is applied to a predetermined level of stress (say 70% RWC) after which the plant is fully rehydrated (typically overnight). OP is then measured and compared with that of a fully hydrated non-stressed plant. It is crucial to remember that OA is proportional (non-linearly) to the rate of water deficit over time. When different genotypes are compared, careful application of drought stress must be applied to all for an extended period of time to a predetermined level of water deficit, best measured by RWC. The difference between the two measures of OP is OA, and the method is defined as the “rehydration method”. A more accurate but a resource demanding method involves the derivation of OA from the relationship between OP and RWC during a drying cycle. The detailed protocols for three methods and the recommendation of the best are given in the comparison of methods. Typical OA values for crop plants can range from null to around 1.5 MPa.
Leaf pressure-volume curve
This is an elaborate laboratory method which can estimate various water status related attributes in a single detached leaf. These are: relative water content at zero turgor, osmotic potential at full turgor and at zero turgor, modulus of elasticity at full turgor, and relative and absolute capacitances at full turgor and at zero turgor. The method involves the development of a curve for each detached drying leaf sample between leaf water potential as measured by the pressure chamber and the respective mass of water loss from the leaf. It therefore involves repeated measurements over time of leaf water potential and leaf weight. See a detailed protocol and a sample spreadsheet for calculations. The method is impractical for large scale phenotyping but is important in certain physiological studies.
Transpiration and stomatal conductance
There are numerous methods for measuring transpiration from single detached leaves, whole plants and whole canopies in the field. Methods vary in applicability, accuracy, cost and speed. The review of all methods is beyond the scope of this site.
Field methods are often based on measuring the amount of water lost from the soil profile over time which represents evapotranspiration. An indirect estimate uses the crop energy balance which requires the measurements of certain given environmental and/or plant variables, depending on the model.
The classical gravimetric method is the oldest and in many cases the most real. It is based on the amount of water lost from a plant grown in a container or from a detached leaf, with known leaf area. Water loss from a pot represents transpiration if soil evaporation is accounted for or eliminated.
Leaf porometers were developed to measure transpiration from intact leaves in the field or the laboratory. The most common technical principle is the exposure of a humidity sensor to the transpiring leaves under standard cuvette conditions (the ‘diffusive resistance porometer’). Porometers vary in function and specifications, where some constitute only a part of a more elaborate system of monitoring total leaf gas exchange. The pressure-drop (or viscous flow) porometer was designed and used in the 1960’ to 1980’s. It is based on the relationship between stomatal conductance and the flow of pressurized air across the leaf. Judging by popularity it seems that this system was dropped in favour of the diffusive resistance porometer, which is also readily available commercially.
The sap-flow method is essential with trees, where transpiration is difficult to measure by other methods. It has been adapted also to certain crop plants such as maize or cotton. This method broadly estimates plant water use by the velocity of sap flow upward in the trunk/stem. A heat pulse applied to the trunk/stem at one point and then sensed above the point of application which allows to calculate sap velocity.
See Materials and Services under our Web Resources link for more information from dealers of various instruments.
Measuring Soil Moisture
An overview of soil-water relations is available via PowerPoint presentation (allow time for download).
Soil moisture content (by volume) and status (by potential or tension) is a major variable affecting plant water status and crop water-use. Extractable soil moisture is the amount of water that a given crop can extract from the soil to a given soil water potential and soil depth. Generally, different crops can use 50% to 80% of the extractable soil moisture before crop transpiration is reduced and plants present symptoms of water deficit. These values change with crop, soil and atmospheric conditions. The determination of soil moisture content or status is of major consideration regarding plant water relations.
Methods of testing soil moisture vary from feeling the soil by hand to remote sensing it from aerial or even space platforms. Methods vary in accuracy, cost, convenience and purpose. The major methods used in farming or in research are detailed in the sites noted below. The basic method is the ‘gravimetric’ where soil samples are taken with an auger and their moisture content is determined by weighing before and after drying in an oven. This remains the benchmark for all other methods. More advanced methods are represented by the ‘Neutron scatter method’ and ‘Time-Domain Reflectometry’ (TDR) method. One popular method used in irrigation is the tensiometer. Regretfully tensiometers found their way into being used in studies under sever soil moisture stress. It should be remembered that the tensiometer is not functional at soil moisture potential below about -0.05 to -0.1 MPa (ca. 0.5 to 1 bar) depending on the make.
The repercussions of plant water deficit
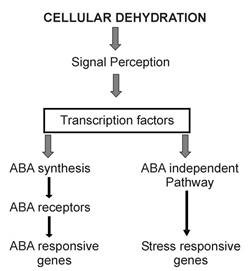
It is not quite clear which are the primary sensors of cellular dehydration and their order of importance or function, be it cellular water status, pressure, bound water, hormones, cellular membrane functions or other agents. It is not perfectly clear how cells perceive cellular water deficit and how cellular water deficit is transduced and transcribed into the various consequences of this stress, be it adaptation or mortality. Furthermore, it has not been clearly established which of these responses are stress adaptive and which are expressions of cellular degradation, shutdown or apoptosis. While certain researchers declared a consensus about a given issue, others did not agree. The working hypothesis underlying current research in this area (Fig. 3) recognizes multiple signal transduction pathways between stress perception and gene expression. Two major possible pathways transcribe the perception of this signal; one involving ABA production and the other is ABA independent. The ABA independent pathway is not fully resolved. In the ABA dependent pathway ABA induces novel protein synthesis, which regulates numerous “ABA responsive” genes. ABA may regulate stress responsive genes without novel protein synthesis. These gene products are either functional (e.g. water-channel proteins or key enzymes) or regulatory (e.g. protein kinases) and they are involved in mediating various cellular responses some of which are recognized as adaptive. The interface between the molecular domain involving stress responsive gene expression and whole plant response and adaptation to drought stress is yet to be fully resolved. This interface is critical for translating molecular genetics science into advances in crop production under stress conditions. At present there are thousands of recognized ‘drought stress responsive genes’ which are up-regulated or down-regulated under the effect of dehydration and the function of only a few has been firmly established with respect to plant adaptation in an agricultural ecosystem. The interface between molecular plant stress research and crop production and breeding under stress is a central area of debate in many publications, reviews and conferences. Our Science Reviews page provides further in-depth information on the molecular research of drought stress.
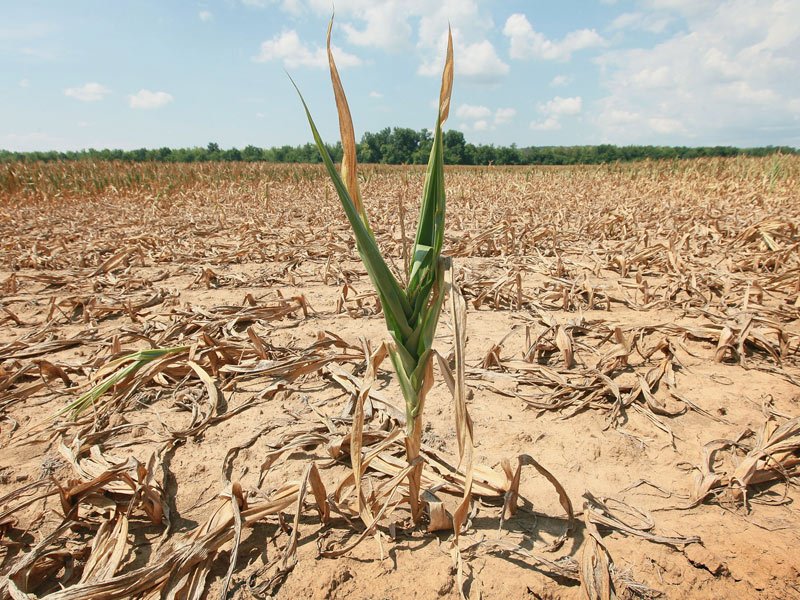
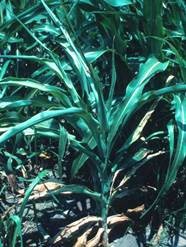
At the whole plant and the crop level, the important repercussions of water deficit are mediated by effects on growth, plant phenology, phasic development, carbon assimilation, assimilate partitioning and plant reproduction processes. These major effects account for most of the variation in crop yield caused by drought stress. Growth depends on cell expansion and cell division. Cell expansion is relatively more sensitive to water deficit. Cell expansion depends on the maintenance of turgor, cell wall extensibility and other factors possibly pertaining also to ABA signalling. Reduced cell expansion and growth as a primary response to water deficit serve to moderate plant water use but also lead to reduced plant productivity. If the reduction in total plant water use is not sufficient to sustain turgor, then transpiration is further reduced by stomatal closure. Initially, stomatal closure reduces transpiration more than it reduces CO2 assimilation so that water-use efficiency appears to increase. At advanced stress both are reduced drastically. Wilting is an expression of turgor loss and it is expressed in specific ways according to plant species, such as the case of leaf rolling in the cereals (Fig. 4).
Reduced cell expansion also carries a primary effect on meristem differentiation and growth such that size of various plant organs is reduced. In grain crops this directly lead to reduced yield components, such as inflorescence size or tillering in the cereals. This is an irreversible structural effect that is difficult to amend by re-watering. It can however be amended to some extent by inter-organ compensation following watering, such as renewed tillering in the cereals. The meristematic tissues are generally positioned within the plant in a relatively protected environment as compared with that of a fully expanded leaf and therefore it may take a severe stress for meristem to lose its turgor. However, ABA transported from stress-affected organs or roots in a drying soil can also arrest meristem development even at relatively high meristem water-status. Thus for example, ABA might affect reproductive failure via pollen dysfunction when water status is not very low.
Water deficit cause advanced or delayed flowering, depending on the species (for example, wheat and rice, respectively). ABA may have a role in this respect as it has been shown to delay flowering in tomato and maize. A delay of up to 50 days has been seen in rice subjected to pre-flowering drought stress. The effect of drought stress on phasic development has been shown to be crucial in affecting maize yield under stress. In maize stress cause a delay in female organ development while the male inflorescence is less affected. Hence, stress causes an increase in the time interval between silking and anthesis. A short anthesis-to-silking interval (ASI) has been shown to be a main feature of drought resistance in maize.
It is widely agreed that the reproductive growth stage is the most drought-sensitive stage. Water deficit can cause reproductive failure. Pollen or pollen mother cells are generally more sensitive to desiccation than the ovary so that male sterility is a common result of drought stress during flowering. Reduced grain set of wheat under drought stress has been ascribed to ABA accumulation in the shoot. An ABA responsive gene has been found in the floral parts of tomato. There are some interesting reports showing that grain set of maize subjected to drought stress could be partially improved by the experimental infusion of sugar solution into the stem, leading to conclude that sugar starvation could be an additional factor in affecting grain set and ovary abortion under stress. Short supply of carbohydrates could very well be a generally important factor in the abortion of fruit/grain under drought stress.
Shortage of assimilates and sometimes nitrogen availability is a major cause of arrested grain and fruit growth during drought stress. Drought stress during cereal grain development reduces the duration of grain filling. If the rate of grain filling is not adjusted upward, final grain weight is reduced. Increased grain growth rate under drought stress depends on the supply of assimilates. This supply is becoming short due to the inhibition of current photosynthesis during stress. An alternative source of stored stem reserves in the form of sugars, starch or fructans, depending on the species. These reserves can be readily utilized for grain filling and their availability may become a critical factor in sustaining grain filling and grain yield under drought stress.
Root/shoot dry weight ratio increase as plant water stress develops. The increase is mostly due to a relative reduction in shoot dry weight. However, there were rare cases where an absolute amount of root dry weight increase was observed under drought stress. ABA may have a role in promoting root growth under drought stress. Osmotic adjustment has also been found to improve deeper root growth under stress. Most certainly root distribution within the soil profile changes as stress develops, in a way that helps the plant to explore deep soil moisture. In the cereals, dry topsoil inhibits the formation and establishment of new roots in the topsoil while assimilates partitioned to the root are used in furthering the growth of existing roots into deeper soil. In the small grains and rice, tillering is associated with the development of new roots from tillers. Therefore, extensive tillering is generally associated with dense and shallow roots while limited tillering tends to associate with sparser and deeper roots. This is one of the reasons why most cereal crop cultivars developed in dry regions tend to have a limited tillering habit.