Refael Aharon, Gad Galili, Abraham Blum12 and Yoram Kapulnik13
Department of Plant Science, the Weizmann Institute of Science, Rehovot 76100, Israel;
and 1Agronomy and Natural Resources Dept., ARO, the Volcani Center, Bet Dagan 50250, Israel;
2presently at www.plantstress.com
3Corresponding author email: kapulnik@volcani.agri.gov.il
ABSTRACT
In order to achieve accurate real-time monitoring of plant water use by means of a simple, multi-channel apparatus, we developed a Micro-Electronic Potometer (MEP). The instrument is built from six units each comprising two parallel vessels joined by a tube; one vessel accommodates a hydroponically grown plant; the other contains a float connected to a high-accuracy linear variable differential transducer (LVDT). Very small changes in water level are recorded by the LVDT output. The potometer responds to a change in water use as little as 1-mL. The instrument was tested by monitoring the water uptake rates of 3-week-old tobacco seedlings and detached tobacco plant organs, following exposure to changes in light intensity and addition of NaCl, HgCl2 or abscisic acid to the root medium. All of these treatments elicited the expected responses in water use within 3-20 min. The advantage of the instrument was also demonstrated in distinguishing between water use of several plant species, including Arabidopsis thaliana cv. Colombia C24 and young pine trees, under normal and stress conditions. This potometer enables the immediate, real-time evaluation of continuous changes in plant water use in response to modifications in the environments of the roots or shoots. Thus, it is a useful, low-cost laboratory instrument for diverse physiological research into plant-water relations.
INTRODUCTION
Plant water status is a major plant stress that directly impacts on photosynthesis and growth rate. The mechanisms that regulate plant water use (PWU; defined as the total amount of water that a plant uses for growth and transpiration) form an important area of research into plant stress physiology and plant breeding.
Several methods have been reported for measuring water use and flow rates in plants. Water flux through the plant can be estimated by measuring changes in pressure potential at desired time intervals, by means of pressure probes (Makoto and Melvin, 2000; Steudle, 1993). Water use can also be evaluated by tracking the sap flow in the stem, which can be determined by the heat flux (Baker and van Bavel, 1987) or the heat pulse technique (Cohen et al., 1981). However, these methods are limited to plants or trees with rigid stems, so that most annual herbage plants cannot be measured easily, if at all. PWU is often evaluated by monitoring the weight loss of intact plants grown in pots, but this procedure is very inaccurate because of the relatively high weight of the pots and soil.
The potometer embodies an old method whereby whole plant roots or detached leaf petioles are immersed in water and the reduction in water level is taken to represent the water used (Pfeffer, 1881; Kaldenhoff et al., 1998). Some of the original potometers had very low resolution (So et al., 1976) and were able to use detached plant organs only, and had a short range of linearity or had to be used over an extended period of time (Lervine et al., 1996; Zwieniecki and Boersma, 1997). Also, these original potometers could not hold plants with their entire root systems (Rosene, 1937; Zwieniecki and Boersma, 1997), and did not allow the transient real-time detection of water use by the roots or shoots of the tested plants (Rosene, 1937; So et al., 1976). Thus, many of the available potometers were unsuitable for recording rapid small changes in real time PWU, such as those that occur in small Arabidopsis thaliana plants.
In this paper we describe a new research Micro-Electro Potometer (MEP), which appears to be sufficiently sensitive to measure small changes in PWU continuously, over short intervals and in real time, and which can be designed to accommodate plants of various sizes. This instrument is also relatively simple to construct and has the potential for use in high-throughput screening studies under diverse growth media conditions.
MATERIALS AND METHODS
Plant material
Tobacco (Nicotiana tabacum L. cv. Samsun) and Arabidopsis thaliana (cv. Columbia ecotype) were used as the main model plants in testing the system. Other plants, including wheat (Triticum aestivum L.), corn (Zea mays L.), tomato (Lycopersicon esculentum Mill.), zucchini squash (Cucurbita pepo L.), bean (Vigna radiate L.) and pine (Pinus pinea L.) were also tested in the comparative screening experiments. All seeds were of certified grade and were obtained from the seed laboratory of the Field and Garden Crops Institute, in the Volcani Center, Bet Dagan, Israel.
Micro-electronic potometer technical description
The gauge was constructed of two glass vessels joined by a 1-cm-diameter glass tube. One vessel – 24 mm in diameter – was designed to accommodate a hydroponically grown plant (the replaceable tube); the other – 30 mm in diameter – contains a plastic float (Dalrin type – constant tube). The float was connected to a high-accuracy linear variable differential transducer (LVDT; type DG 2.5, from RS Components, Tel-Aviv, Israel) (Figure 1A). The LVDT could measure a maximum displacement of 2.5 mm with an accuracy of 0.15 mm (manufacturer’s data). It was connected to a data logger (ADC-16, from RS Components, Tel-Aviv, Israel) that was interfaced with a personal computer (Figure 1B). The whole instrument comprises a support platform carrying six independent gauges, each of which could be used and recorded independently. The detection unit was placed on a compact vibration-isolation platform (Bench Top – 2024, from Lahat Technologies Ltd, Tel-Aviv, Israel). The oxygen level was monitored with a Micro Oxygen Electrode (MI-730, from Mirom Ltd, Haifa, Israel). Light was provided by a fluorescent lighting system giving 250 mE m-2 s-1 at the plant level. The experiments were carried out under conditions of stable room temperature (22-24oC) and constant relative humidity (65-75%).
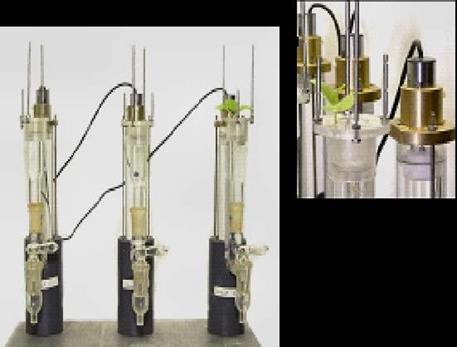 |
Figure 1.A. The micro-electronic potometer system: A. Overview. |
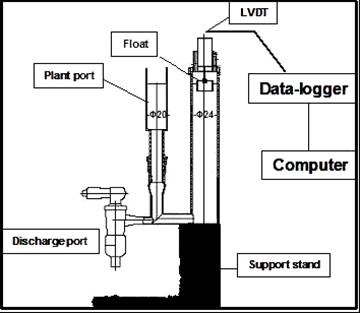 |
Figure 1.B. The micro-electronic potometer system: B. Design. The main components of the instrument are the LVDT (linear variable differential transducer), the float, the changeable plant port (normal capacity, 190 mL), the plant support columns and the data logger. Detailed plans are available by writing to the corresponding author at kapulnik@volcani.agri.gov.il |
Potometer evaluation
Hydroponically grown plants were used in all experiments. Three-week-old plants were transferred from the greenhouse to hydroponic culture in a growth chamber (Lumintron, from CE Ltd, Canada) at 25/22oC (day/night) under a 12-h photoperiod with full light intensity of 250 mE m-2 s-1, and were allowed to adjust for 4 days. The volume of the roots was measured by inserting them into the plant port of the gauge and recording the changes in water level in microliters. After the plants had been tested in the MEP, their leaf area was determined photographically (Whitford et al., 1995). The experiments were performed at least twice, and each experimental treatment was performed with five replications, unless stated otherwise. Data were analyzed with the JMP statistics package (version 3.1.5, from SAS Institute Inc.). Preliminary experiments indicated that water use was stable and linear as long as the oxygen level in the plant port solution did not fall below 75% of the initial oxygen partial pressure. In all subsequent experiments the dissolved oxygen concentration was not allowed to fall below 80% of the initial level, in order to avoid root anoxia.
To evaluate the effect of salinity on PWU, the plants in the MEP tubes were exposed to tap water (control), or to 45 or 100 mM NaCl solution. In order to evaluate the effect of abscisic acid (ABA) on PWU, plants were monitored under optimal conditions (control treatment); the MEP tubes were then filled with 0.02 mM ABA solution and the water uptake of the plants was measured up to 18 h after treatment. The effect of mercury on PWU was evaluated by comparing the performance of plants under normal conditions (control treatment) with that of plants that had been incubated with 0.05 mM HgCl2 solution for 15 min before and during the measurement. The effect of darkness on PWU was tested by covering the plants with a sealed aluminum box or by switching off the lights in a lightproof room.
RESULTS AND DISCUSSION
Short- and long-term measurements
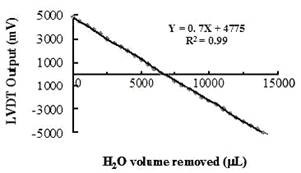 | 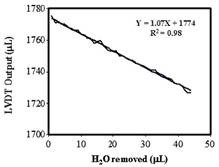 |
Figure 2.A. Calibration of the micro-electronic potometer. Accurately measured amounts of water were removed from the plant port (500 mL each time) and the MEP readings were recorded. | Figure 2. B. Sensitivity test. Successive aliquots of water were removed (1 mL each time) from the plant port, and the MEP readings were recorded (mL). |
The system was full-scale calibrated at 240C, by recording LVDT output (in millivolts) against incremental water withdrawals from the plant port, and a linear curve was obtained (Figure 2A). To evaluate its sensitivity 44 aliquots of 1 mL of water which were successively removed from the plant port were compared with the respective LVDT output as mL water (Figure 2B). This association was very strong (R2=0.98) indicating high sensitivity of LVDT to water level changes. Figure 3 presents the comparative rates of water loss from the plant port as a result of evaporation (no plant in the plant port) and the presence of an Arabidopsis plant. In both cases, water loss from the port was linear with time up to the end of the test (15 h in this experiment). As expected water loss by plant transpiration was higher than evaporation. In all subsequent measurements, the evaporative water loss was subtracted from the measured water losses from ports containing plants. Small Arabidopsis plants with four full leaves were introduced into the plant port and the variation of water use over time was monitored for longer periods of time. The rate of water loss from the plant port was linear from the 3rd minute after initial detection of PWU to at least 96 h (data not shown). Therefore, long-term (days) as well as short-term (minutes) experiments can be accommodated by this MEP system. Furthermore, the relatively inexpensive and easily constructed and handled configuration allowed the use of several stations in parallel, thus facilitating the online analysis of several parallel treatments in one run.
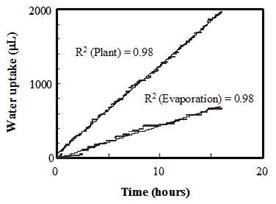 | 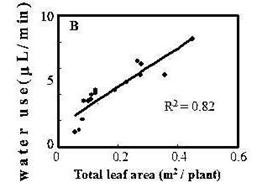 |
Figure 3. Water use of a small Arabidopsis plant over 15 h as compared with the evaporation rate. | Figure 4. Regression of tobacco plant water use on leaf area. |
Effect of plant attributes on water use
Regressions of water use on leaf fresh weight (F.W.), shoot F.W., total F.W. (root + shoot), and leaf area per plant (Figure 4) were linear and very significant with R2 values of 0.83, 0.82 and 0.78, respectively. These results are consistent with the normalizing units used in similar studies elsewhere (Herbst et al., 1996; Lambers et al., 1990; Poorter and Farquhar, 1994).
When the root volume of an individual tobacco plant was reduced (by successive trimmings) a positive association (R2 = 0.63) was found between the remaining root volume and plant water use (Figure 5).
The effect of light on the PWU of tobacco plants was studied by shifting the plants from light to total darkness. The air temperature at the canopy level was reduced by 2oC after 60 min in darkness. As shown in Figure 6, reduction in the PWU was evident after 50 min in darkness, as indicated by the change in the slope of the curve, compared with that of the control illuminated plant. PWU was reduced by nearly 87% in darkness, compared with that under illumination (data not shown). Our results suggest that closure of stomata occurred after 50 min in darkness, which is consistent with the previous results of Eun and Lee (1997).
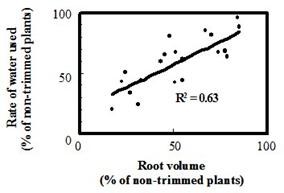 | 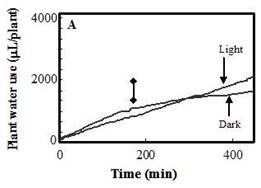 |
Figure 5. The effect of root volume on the rate of plant water use. Roots of hydroponically grown tobacco plants were trimmed to differing extents and their water use measured. | Figure 6. The effect of darkness on water use of tobacco plants. Water use as a function of time by tobacco plants in light (control) or in darkness (Dark). Darkness was imposed after 175 min (double-headed arrow). |
Effect of root-medium composition on water use
The MEP was used to test the effects of the addition of various chemicals to the root medium on the PWU. In testing the effects of salt stress in media containing 45 or 100 mM NaCl, PWU measurements began immediately after the beginning of the exposure to salt and continued for 60 min. The effect of NaCl on water use was already apparent within 3 min, and a slightly biphasic response was obtained in the salt-treated plants (Figure 7). Exposure of plant roots to 45 and 100 mM NaCl decreased steady state rate of water use by 24 and 50%, respectively, relative to non-stressed control plants (data not shown). Under mild salt stress (up to 60 mM NaCl) plants partially close their stomata (Maccrree et al., 1984) and reduce their root hydraulic conductivity (Rodrigues et al., 1997). Our results demonstrated the very fast response of the plant to salinity, and the ability of the MEP to track such fast and small responses in plant water use.
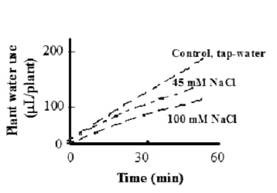 |  |
Figure 7. Effects of NaCl levels on water use by tobacco seedlings. | Figure 8. Effect of mercury on water use by tobacco plants: Tobacco seedlings were divided into two groups, one was pretreated with 50 mM HgCl2 (HgCl2) and the second with water (control) for 15 min. Both groups were removed into tap water and their water use rates were recorded as functions of time. Bars represent standard error of the means |
Mercury is an inhibitor of certain classes of aquaporins (Maurel, 1997). A 15 min pre-treatment of the plants with 50 mM mercury as HgCl2, after which they were returned to tap water, resulted in a 71% reduction in the PWU rate (Figure 8). When plant water use was measured immediately after mercury application (i.e., the medium contained 50 mM mercury), a shift in water use was already observed after 3 min and the PWU continued to increase linearly with respect to time (data not shown). Thus, the MEP was effective in detecting reductions the symplastic water flux as caused by an aquaporin inhibitor.
When the root system was challenged with ABA, two phases of response were detected: in the first 60 min there was a rapid decrease in water use (by 42%) compared with that of control plants (Figure 9 – inset); in the next 21 h there was a slower rate of decline in water uptake, to a final reduction of 75%. The immediate response of plants to ABA is well known (see review by Giraudat et al., 1994), and a long-term response has also been reported (Franks and Farquhar, 2001). The instrument was effective in tracking both of these phases over a period of 21 h.
The capability of the MEP to measure water uptake by detached organs was also tested (Table 1). In all cases, water use increased linearly with time, but at distinct rates for the different organs. This finding extends the options available in research into plant-water relations. For example, water use of detached roots is an indicator of the active pressure in the roots (Frensch and Steudle, 1989; Schobert and Komor, 1990; Steudle, 2000b) and it can also be used to investigate total root hydraulic conductance.
| 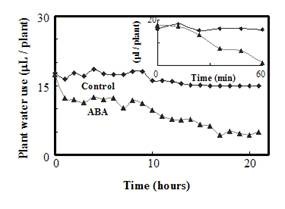 | ||||||||||||||||
Table 1. Rates of water use of different plant species. Plants were grown hydroponically for 2 weeks and their leaf area measured. Means with different letters are significantly different at p<0.05. | Figure 9. Effect of ABA on water use by tobacco seedlings: Water use as a function of time by plants exposed to 20 mM ABA for 22 h, relative to that of control plants in tap water. Inset- the effect of 20 mM ABA on water use in the first 50 min. The experiment was repeated five times with similar results. |
Water use by different plant species
The ability of the system to measure water use by different plant species was tested. Arabidopsis (Arabidopsis thaliana), tobacco (Nicotiana tabacum), wheat (Triticum aestivum), corn (Zea mays), tomato (Lycopersicon esculentum), zucchini squash (Cucurbita pepo) and bean (Vigna radiata) were germinated and grown in pots for 10 days. Pine (Pimus pinea) was germinated on seed germination paper (Anchor Paper Co., USA) for 15 days; all the seedlings were then transferred to hydroponic systems for another 2 weeks, after which their water uses were measured for 40 min (Table 1). Tomato plants had the highest water use per leaf unit area (0.17 mL cm-2) and wheat the lowest (0.065 mL cm-2). Conifers are difficult to accommodate in the many potometers available on the market, because of their non-flat leaf shape, but when the MEP instrument was used for pine seedlings (Pinus pinea), a water uptake rate of 80 mL g-1 of root D.W. was measured. The ability to monitor water use of pine seedlings enables the evaluation of different accessions for differences in water uptake capacity.
The results with arabidopsis also demonstrate the sensitivity of the instrument in detecting very small changes in plant water use. Moreover, the versatility of the instrument and the ability to replace a plant port with one of a different size may facilitate measurements with various plant species that differ in size and architecture.
Taken as a whole, our results demonstrate that this potometer system is suitable for the reliable, real-time measurement of small changes in plant water use over short (minutes) or long (hours) time intervals. In the light of these capabilities, this instrument can be seen to be a useful addition to the tools available for research into plant-water relations.
ACKNOWLEDGEMENTS
GG is the incumbent of the Bronfman Chair of Plant Sciences at the Weizmann Institute. This work was partially supported by grant No. 891-0155-99 from the Chief Scientist of the Ministry of Agriculture and Rural Development, Israel.
NOTE
Detailed plans for constructing this instrument are available by writing to the corresponding author at kapulnik@volcani.agri.gov.il
LITERATURE CITED
Ansley R J, Dugas W A, Heuer M, Land Trevino B A 1994 Stem flow and potometer measurements of transpiration from honey mesquite (Prosopis glandulosa). J. Exp. Bot. 45, 847-856.
Baker J M and van Bavel C H M 1987 Measurement of mass flow of water in the stems of herbaceous plants. Plant Cell Environ. 10, 777-782.
Cohen Y, Fuchs M and Green G C 1981 Improvement of the heat pulse method for determining sap flow in trees. Plant Cell Environ. 7, 391-397.
Eun S O and Lee Y 1997 Actin filaments of guard cells are reorganized in response to light and abscisic acid. Plant Physiol. 115, 1491-1498.
Franks P J and Farquhar G D 2001 The effect of exogenous abscisic acid on stomatal development, stomatal mechanics, and leaf gas exchange in Tradescantia virginiana. Plant Physiol. 125, 935-942.
Frensch J and Steudle E 1989 Axial and radial hydraulic resistance to roots of maize (Zea mays L.). Plant Physiol. 91, 719-726.
Giraudat J, Parcy F, Bertauche N, Gosti F, Leung J and Vartanian N 1994 Current advances in abscisic acid action and signaling. Plant Mol. Biol. 26, 1557-1577.
Herbst M, Kappen L, Thamm F and Vanselow R 1996 Simultaneous measurements of transpiration, soil evaporation and total evaporation in a maize field in northern Germany. J. Exp. Bot. 47, 1957-1962.
Kaldenhoff R, Grote Z, Zhu J J and Zimmermann U 1998 Significance of plasmalemma aquaporins for water transport in Arabidopsis thaliana. Plant J. 14, 121-128.
Lambers H, Poorter H and Remkes C 1990 Carbon and nitrogen economy of 24 wild species differing in relative growth rate. Plant Physiol. 94, 621-627.
Lervine J, Hadjiloucas S, Keating D A and Usher M J 1996 An automatic optical fibre feedback potometer for transpiration studies. Meas. Sci. Technol. 7, 1611-1618.
Maccree J, Craig E K and Richardson S G 1984 Carbon balance and water relations of sorghum exposed to salt and water stress. Plant Physiol. 76, 898-902.
Makoto T and Melvin T T 2000 Plant hydraulic conductance measured by the high pressure flow meter in crop plants. J. Exp. Bot. 51, 823-828.
Maurel C 1997 Aquaporins and water permeability of plant membrane. Annu. Rev. Plant Physiol. Plant Mol. Biol. 48, 399-429.
Pfeffer W 1881 Wasserbewegung in der Pflanze. In Pflanzenphysiologie ein Handbuch, Leipzig: Verlag von Wilhelm Engelmann, 113-178.
Poorter H and Farquhar G D 1994 Transpiration, intercellular carbon dioxide concentration and carbon isotope discrimination of 24 wild species differing in relative growth rate. Aust. J. Plant Physiol. 21, 507-516.
Rodrigues P, Dell J and Alerson D 1997 Effects of salinity on growth, shoot water relations and root hydraulic conductivity in tomato plants. J. Agri. Sci. 128, 439-444.
Rosene F H 1937 Distribution of the velocities of absorption of water in the onion root. Plant Physiol. 12, 1-19.
Schobert C and Komor E 1990 Transfer of amino acids and nitrate from the roots into the xylem of Ricinus communis seedlings. Planta 181, 85-90.
So H B, Aylmore L A G and Quirk J P 1979 Measurement of water fluxes and potentials in a single root-soil system. Plant Soil 45, 577-594.
Steudle E 1993 Pressure probe techniques: basic principles and application to studies of water and solute relations at the cell, tissue and organ level. Oxford, BIOS Scientific Publishers. 5-36.
Steudle E 2000a Water uptake by roots: an integration of reviews. Plant Soil 226, 45-56.
Steudle E 2000b Water uptake by roots: effects of water deficit. J. Exp. Bot. 51, 1531-1542.
Whitford K, Colquhoun I, Lang A and Harper B 1995 Measuring leaf area index in a sparse eucalypt forest; a comparison of estimates from direct measurement, hemispherical photography, sunlight transmittance and allometric regression. Agric. For. Met. 37, 237-249.
Zwieniecki M A and Boersma L 1997 A technique to measure root tip hydraulic conductivity and root water potential simultaneously. J. Exp. Bot. 48, 333-336.