Soil salinity (accumulation of salts in the surface zone) has a number of causes, which differ in different geological and climatic regions. The causes can be natural, be due to clearing of native vegetation (‘dryland salinity’), or due to irrigation (Table 1). Mitigation of soil salinity and its impact on plants must therefore be considered somewhat differently in the context of these three scenarios. Salinity is often accompanied by other soil properties, such as sodicity, alkalinity, or boron toxicity, which exert their own specific effects on plant growth. Waterlogging often accompanies salinity due to clearing or to irrigation. This article will consider only salinity.
Table 1. Classes of soil salinity and expected land use. (*ECe of a saturated extract which approximates saturated field water content).
| |||
Degree of salinity | Site characteristics | Use | Species
|
Low salinity (ECe*=2 to 4 dSm-1) | Natural salinity; often seasonally dry Irrigation salinity; can be waterlogged after irrigation | Cropping | Low-moderate salt tolerance |
Moderate salinity (ECe= 4 to 8 dSm-1) | Dryland salinity; often seasonally waterlogged | Crop-pasture rotations | Moderate-high salt tolerance |
High salinity (ECe > 8 dSm-1) | Discharge areas; can be seeping or dry according to season | Grazing or revegetation | Halophytes |
Salts in soils are primarily chlorides and sulfates of sodium, calcium, magnesium, and potassium. Symptoms of soil salinity include slow and spotty seed germination, sudden wilting, stunted growth, marginal burn on leaves (especially lower, older leaves), leaf yellowing, leaf fall, restricted root development, and sudden or gradual death of plants.
This article describes two ways in which salinity stress of crops can be mitigated – by changing farm management practices, and by breeding for increased salt tolerance in crops. The article accompanies the previous one “Salinity Stress and its Impact” which outlines the mechanisms of salt tolerance in different species. Here we describe various traits for salt tolerance that can be used to select for tolerant genotypes in breeding programs
Mitigation of Salinity Stress by Management Practices
The management solution is different in the three types of salinity.
Irrigated Agriculture and Salinity
All soils contain salts, and all irrigation waters, whether from canals or underground pumping, including those considered of very good quality, contain some dissolved salts. Hence, the process of soil salinization is dramatically exacerbated and accelerated by crop irrigation. The overall effect of irrigation in the context of salinity is that it “imports” large quantities of new salts to the soil that were not there before.
Removal of salts from the root zone (reclamation) is perhaps the most effective and longer lasting way to ameliorate or even eliminate the detrimental effects of salinity. However, in addition to being slow and expensive, the process requires large quantities of water and effective soil drainage. Consequently, it is not always possible or feasible to carry out a “true reclamation” operation. A number of different approaches involving removal or reducing the salts may be considered.
- Soil Reclamation:The process of “true reclamation” involves replacing sodium ions in the soil with calcium. The released sodium ions are then leached deep beyond the root zone by using excess water and finally carried out of the field in the drainage water. The most commonly used method for replacing the sodium ions is by applying large quantities of gypsum (calcium sulfate) to the soil and followed by water ponding. The applied gypsum slowly dissolves in the water releasing calcium ions which replace sodium ions from the soil into the downward moving water. Lime (calcium carbonate) is not used as saline soils are sometimes already high in carbonate salts and are therefore alkaline. The reclaimed soils can become saline again unless appropriate management practices are followed.
- Various management practices based on reducing the salt zone for seed germination and seedling establishment:The early seedling establishment and tillering phase are generally the most sensitive stages to salinity. Any management practice that could provide an environment of reduced salt concentration during these stages would mitigate the salinity effects and benefit the crop by promoting plant densities and early seedling growth. A number of approaches have been used.
2.1. Scraping and removal of surface soil: Due to continuous evaporation the salt concentration is the highest in the surface soil. The top soil can be scraped and transported out of the field. The practice has been used in many areas of the world (Qureshi et al., 2003).
2.2. Pre-sowing irrigation with good quality water: Where available, irrigation with good quality water prior to sowing helps leach salts from the top soil. This helps in promoting better seed germination and seedling establishment. The benefits of this practice were documented in a long-term study by Goyal et al (1999 a,b).
2.3. Appropriate use of ridges or beds for planting: The impact of salinity may be minimized by appropriately placing the seeds (or plants) on ridges. Where exactly the seeds should be planted on the ridge or bed will depend on the irrigation design. If the crop planted on ridges would be irrigated via furrows on both sides of the ridge, it is better to place plants on the ridge shoulders rather than the ridge top because water evaporation will concentrate more salts on the ridge top or center of the bed. If the crop is irrigated via alternate furrows, then it is better to plant only on one shoulder of the ridge closer to the furrow that will have water. For additional benefits, this approach may be combined with pre-irrigation (2.2) via furrows or sprinklers which will help reduce salt concentration in the area where seeds or plants are to be placed.
2.4. Planting into a pre-flooded field: An interesting approach has been widely used in the San Joaquin Valley of California to grow safflower crop on salt affected soils. Prior to planting, the field is flooded with good quality water. Just as most of the water has percolated into the soil and only a few millimetres of standing water are left, the seeds are flown over the field via an aircraft. The seeds traveling under the force of gravity get imbedded into the muddy soil surface where the salt concentration is expected to be the lowest. The approach has provided good seed germination and seedling establishment (Goyal et al., 1999 a,b).
- General management practices to reduce the impact of soil salinity on crop performance:In addition to the management practices mentioned above, the following approaches may help reduce salinity impacts.
3.1. Mulching: Mulching with crop residue, such as straw, reduces evaporation from the soil surface which in turn reduces the upward movement of salts. Reduced evaporation also reduces the need to irrigate. Consequently, fewer salts accumulate.
3.2. Deep Tillage: Accumulation of salts closer to the surface is a typical feature of saline soils. Deep tillage would mix the salts present in the surface zone into a much larger volume of soil and hence reduce its concentration and impact. Many soils have an impervious hard pan which hinders in the salt leaching process. Under such circumstances “chiseling” would improve water infiltration and hence downward movement of salts.
3.3. Incorporation of Organic matter: Incorporating crop residues or green-manure crops improves soil tilth, structure, and improves water infiltration which provides safeguard against adverse effects of salinity. In order for this to be effective, regular additions of organic matter (crop residue, manure, sludge, compost) must be made.
Irrigated agriculture can be sustained by better irrigation practices such as adoption of regulated deficit irrigation (RDI) or partial root zone drying methodology, and drip or micro-jet irrigation to optimise use of water. Current levels can be controlled by leaching fractions, where fresh irrigation water is available, and by drains.
The leaching fraction is the fraction of the applied water that passes through the root zone; this carries salts below the root zone. The smallest leaching fraction that maintains maximum crop productivity is called the ‘leaching requirement’. It depends on the salt content of the irrigation water and the salt tolerance of the crop.
Table 2. Leaching requirement for typical irrigation waters in California as related to salt tolerance of crop (taken from J.D. Oster, G.J. Hoffman and F.E. Robinson, California Agriculture, October 1984). | ||||
Salinity of applied water (dS/m) | Leaching requirement | |||
Sensitive crop | Moderately sensitive crop | Moderately tolerant crop | Tolerant crop | |
0.05 (freshwater canal) | 0.01 | 0.01 | 0.01 | 0.01 |
0.3 (California aqueduct) | 0.05 | 0.02 | 0.02 | 0.02 |
1.3 (Colorado River) | 0.14 | 0.07 | 0.04 | 0.02 |
5.0 (reused drainage) | not possible | 0.27 | 0.15 | 0.10 |
If more than 30% passes through the root zone, the cost of drainage, or the risk of rising water tables, becomes too great. Hence, increasing the salt tolerance of crops is desirable. Salt tolerant crops are also needed if the drainage water is to be reused.
The disposal of saline drainage water from salt-affected irrigated land has been a controversial issue, and recycling of such waters has been considered for further crop irrigation. Feasibility studies indicate that re-use of drainage water is suitable for irrigation of moderately salt-tolerant crops. Up to 4 dS/m can be used for irrigation of moderately tolerant crops provided that the ground is leached with fresh water before sowing. With the more salt tolerant crops like sugar beet and cotton, the use of water up to 9 dS/m can be sustained for three years, but for a longer period the salinity must be reduced to 5 dS/m (Goyal et al. 1999 a,b).
Dryland Agriculture and Salinity
The causes of dryland salinity are in principle well understood. The replacement of perennial deep-rooted native vegetation by shallow-rooted annual crops or pastures results in wetter subsoils and accompanying larger deep drainage beyond the reach of shallow roots, leading eventually to rising water tables. If the ground water is saline, which it commonly is in semiarid environments, salt scalds appear when the water tables reach the soil surface. Even if the water tables are only brackish rather than saline the surface can become saline owing to the salt concentrating as water evaporates.
The essential difference, hydrologically, between native perennial vegetation and annual crops is that the perennials can use substantial amounts of water throughout the whole year. In a Mediterranean environment, for example, with its winter wet season, there is little difference during the winter in water use by annual or perennial vegetation. Rainfall that substantially exceeds evaporation during the winter may penetrate deeply into the subsoil under both types of vegetation. But during the summer, when the crops have been harvested, the perennials, enabled by their deep roots, can use water that may have penetrated well beyond the rooting depth of the crops during the winter.
Thus, mitigation of dryland salinity in cropping lands requires control of drainage beyond the reach of the crop roots. There is no single solution. There is, however, a range of options that farmers can select from, including growing longer-season crops, which tend to have deeper roots, and various techniques for incorporating some deep-rooted perennial species into cropping systems to tap the water in the deep subsoil that may have accumulated during a wet season (Black et al., 1981).
Phase farming is one effective way of incorporating perennials into a cropping system. It involves the tactical rotation of herbaceous perennial pasture, such as alfalfa (lucerne) which can be grazed or harvested for hay, with a series of annual crops. The perennial pasture dries the subsoil below the roots of annual crops, thereby creating a buffer zone in which water and nutrients that leak below the crops can be held for a few seasons, remaining largely accessible to the roots of the next phase of deep rooted perennials. A special issue of the Australian Journal of Agricultural Research (vol 52(2), 2001) contains several papers that discuss phase farming. One general conclusion from these is that the size of the buffer created by herbaceous perennials varies, reflecting soil type and local climate as well as species, from about 50 to 150mm. The larger values were due to lucerne and were typically achieved within two years of establishment. Phalaris was less effective than lucerne in developing the buffer. Danthonia and Eragrostis, were less effective still. With deep drainage under crops averaging about 30 to 50 mm per year, such buffers can deal with one to five years of drainage below the roots of crops.
.
Strips of woody perennials can also help, though their effectiveness is limited by the maximum lateral movement of water through unsaturated soil to their roots, which is typically no more than about 1 m. Even though surface roots may spread from the tree for a distance several times the spread of the canopy (and thereby reduce yields of adjacent crop), the deeper roots typically do not spread so far and the strips may do little more than control deep drainage only in a strip of soil little larger than the width of the canopy (Stirzaker et al., 2002). If the roots of such perennials can tap the groundwater, though, the lateral flow towards them can be large enough for them to take up a lot of water that might otherwise flow to lower points in the landscape, providing that the water is not too saline. The appropriate proportion of woody perennials to herbaceous species depends on the competitive interactions at the interface between trees and crop or pasture as well as on the ability of trees to extract groundwater and considerations of both help determine the area of cropland that needs to be sacrificed.
Another possibility is to identify, using georeferenced yield monitors, areas giving consistently poor yield. Such areas, which are especially prone to deep drainage, can be excluded from cropping, and put under either permanent perennial pasture or trees.
Determining the right mix of these various options, both in time and space, is hampered by the difficulty of estimating what the deep drainage is and how it may vary with season and treatment. Few long-term measurements are available. The development of a cheap drainage meter (Hutchinson et al., 2001) may help overcome this deficiency and help farmers find out what is happening on their own farms. Augmenting such measurements with reliable simulation models, of both phase farming and agroforestry, will also help. Essential input for such models includes the effective water-holding capacity of the soil as a function of depth and the effective depths of rooting of both the perennials and the crops. That the depths of rooting can depend markedly on season and cropping history is a considerable challenge. A reliable model can help estimate the impact of seasonal variability and management decisions on deep drainage by running the model through several decades of rainfall records; it should also be able to guide those management decisions, at least if the troublesome groundwater system is local. Where an outbreak of dryland salinity is a long way from where the accessions to groundwater are occurring, hydrologic models and measurements are needed, and although these can handle general flows of groundwater, they are as yet not able to guide specific actions on farms.
If these various options for reducing deep drainage are effective in lowering water tables so that any salt scalds dry out, there is still the problem that the salt remains in the root zone. Further rehabilitation requires a succession of plants, starting with halophytes, with can take up the water and thereby create space for rain to wash the salt deeper into the soil profile. Salt tolerant crops may then be able to grow there, and enable further leaching of the salt. If the soil has become sodic, chemical amelioration (say, with gypsum) may also be necessary.
Natural Salinity
Natural salinity occurs in the low rainfall zones, of 300-400 mm and below, where even an annual crop can use all the rain, so water tables are not disturbed.
Can salt be removed from the soil? In the cases of natural salinity, with no rising water tables and no movement of salt to the surface, it may be envisaged that salt could be removed from the soil by crops that accumulate salt. However, calculations do not support this idea. First, the grain does not contain any salt, so the normal harvesting methods do not remove any salt. The straw contains salt, but if it is reincorporated or used for animal fodder, the salt will still be returned to the soil. Fruit of horticultural species contains little salt as well, so in both cases, the straw or trash would need to be transported away from the site and into catchments that empty directly into the ocean.
If we presume that the trash can be removed to a safe site, how much salt will it remove from the field? If the vegetative harvest is 5 tonnes per Ha per year, and if it contains 10% salt per unit dry matter, then the harvest of salt would be 0.5 tonne/Ha/year. However, the amount of salt in the topsoil could be over 15 tonnes/Ha (for the top 1 m of soil containing salt at 10 dS/m in the soil water). So 30 years would be required to remove the salt from the top 1 m. This supposes that a vegetative harvest of 5 tonnes can be sustained (which is unlikely) and does not take into account that salt is continually added to the soil in the rain and wind, or in any irrigation water that might be used to produce a 5 tonne crop.
So for natural salinity, as well as for irrigated and dryland, improving the salt tolerance of crops is a useful approach.
Mitigation of Salinity Stress by Exploiting Plant Salinity Tolerance
- Conventional crop and pasture breeding for salt tolerance
As described in the companion article (Salinity Stress and its Impact), species vary in their capacity to tolerate salinity. Amongst the major crop species, barley, cotton, sugar beet and canola are the most tolerant; wheat and lucerne (alfalfa) are moderately tolerant, while rice and most legume species are sensitive. For a more complete list of crops see Richards (1969).
There is also variation in salinity tolerance within species, especially in outcrossing species like lucerne. The classical breeding approach is to (1) screen collected germplasm for salinity tolerance, (2) cross the identified tolerant types with the desired cultivars and (3) selecting the desired plant types having salinity tolerance as well as other desirable traits from the advancing and segregating generations. By exploiting the naturally occurring genetic variability that exists within a species, some relatively tolerant cultivars have been developed for crops including rice, wheat, lucerne, white clover and citrus.
There is probably a great diversity in salinity tolerance within species that has not been fully explored and exploited. One reason for this is the difficulty of screening large numbers of individuals for small, repeatable and quantifiable differences in biomass production, let alone yield. Obtaining a wide range of germplasm with potential genetic differences in salinity tolerance is not difficult, because international collections are usually available to any scientist. However, the difficulty lies in how to measure salinity tolerance.
How to measure salinity tolerance
Salinity tolerance is difficult to measure because of its complexity. Not only are there a number of genes controlling salinity tolerance whose effect interacts strongly with environmental conditions, but there are two major and distinct components of salinity tolerance which can often be difficult to distinguish (Munns 2002).
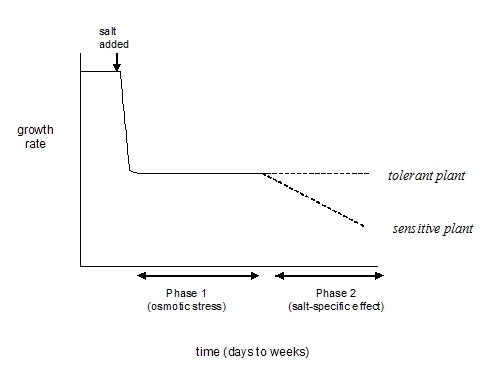
Salinity imposes two major stresses on the plant: one is a high osmotic pressure in the soil solution making it harder for the plant to extract water, the second is a high NaCl concentration in the soil solution that makes it difficult for the plant to exclude the NaCl while taking up other cations and anions. The effect of these two stresses are seen in sequence. Salinity lowers the water potential of the roots, and this quickly causes reductions in growth rate, along with a suite of metabolic changes identical to those caused by water stress. Later, there may be salt-specific effects that impact on growth or senescence. This two-phase model is summarized in Fig. 1, and described in more detail in the companion article ‘Salinity Stress and its Impact’.
How to screen for differences in salinity tolerance within species based on growth
Screening based on growth needs to allow for the two distinct mechanisms for salinity tolerance: tolerance to the osmotic effect of the saline soil solution, and tolerance to the salt-specific nature of the saline solution.
The osmotic effect alters the water relations of the plant, and reduces the rate of cell expansion. This leads to a reduction in the rate of development of new roots, leaves and lateral shoots. The osmotic effect also reduces stomatal conductance, which leads to reduced photosynthesis. It also causes accelerated senescence of older leaves. Thus there are three somewhat independent processes being affected (i.e. new leaf formation, old leaf death and photosynthetic activity) that all contribute to a reduction in the net assimilation rate of the plant. These effects are identical to drought.
The osmotic effect occurs instantly the soil water potential decreases, and recovers instantly it increases (Fig. 2). If the period of stress is short (hours) the recovery is complete. If the period of stress is long, the recovery is more limited, as stress may have already reduced the number of lateral shoots, and the number of cells in the dividing zones of growing roots and leaves, so that there are a reduced number of cells to respond.
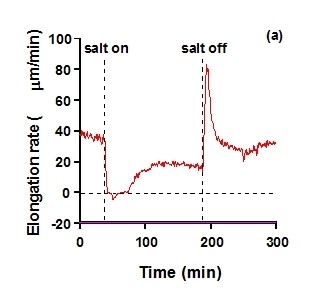
Figure 2. The effect of changes in salinity of soil solution on elongation rate of a barley leaf, (a) with no control of leaf water status, and (b) with the plant maintained at balancing pressure, i.e. at constant leaf water status, throughout the changes. The vertical broken lines mark the times at which the light was turned on or off, and the broken horizontal line in (a) marks zero elongation rate. At the changes, full strength nutrient solution was exchanged with the same solution containing 75mM NaCl, or vice versa. Reproduced from Passioura and Munns (2000).
Responses of leaf elongation are greater than of root elongation (Munns 2002). The reason for this is not known, but it means that leaf elongation or leaf expansion rates are a more sensitive indicator of osmotic stress than root elongation rates.
The genetic variation in the growth response to the osmotic effect of salinity is likely to be small, both within a species, and across similar species. For example, we found little difference between the effect of salinity on leaf elongation in 15 cultivars of bread wheat, durum wheat, barley and triticale, cultivars with established differences in reputation for salinity tolerance. All 15 cultivars had the same decrease when the salt was increased from 0 to 250 mM NaCl over 10 d. Even the most salinity-sensitive genotype, a durum wheat cultivar, had the same percentage reduction as the most salinity-tolerant genotype, a barley cultivar. In fact, there is a remarkable similarly between different species in the osmotic response in saline solution. For instance, 100 mM NaCl causes approximately 50% decrease in leaf elongation rate of the salinity-sensitive species maize and rice, and nearly as much in the salinity-tolerant species bread wheat and barley. Longer term growth responses clearly differ.
The osmotic effect has the same characteristics as drought, so genotypes could be screened for drought tolerance. But this is not easy either (see ‘Drought Stress and its Impact).
The salt-specific effect causes increased uptake of Na+ and Cl–, and decreased uptake of essential cations particularly K+ and Ca2+. Uptake of Cl– may alter uptake of anions such as phosphate and nitrate but these effects are complex and vary between species. If the uptake of Na+ or Cl– exceed the plant’s ability to partition the ions between different tissues or organs, or to sequester (‘compartmentalise’) the ions within the cell’s vacuole, these ions build up in the cytoplasm to toxic concentrations.
The salt-specific effect shows up in old leaves that have accumulated excessive amounts of Na+ and Cl–. While it may be visible, in that old leaves die earlier, it may not affect the rate of new leaf production for some time. The salt-specific effect on growth is not seen until after the osmotic effect on growth (Fig. 1). The length of time required before the growth differences between genotypes due to the salt-specific effect can be seen depends on the salinity and the degree of tolerance of the species. This represents a ‘second phase’ of the growth reduction. The second phase will start earlier in plants that are poor excluders of Na+, and will start earlier when root temperatures are higher. For plants such as rice that are grown at high temperatures, two weeks’ days in salinity is sufficient to generate differences in biomass between genotypes that correlate well with differences in yield. However, for temperate crops, as at least a month is needed for genotypic differences in the response of biomass production to take effect.
The labour and space demands of these long experiments makes them impractical for screening large numbers of genotypes, or selecting salinity-tolerant progeny resulting from crosses with cultivars. Not only do plants need to be grown for lengthy periods of time, but controls need to be included. Control plants consumes a large area of glasshouse space if they are to be grown at their optimum rate, with sufficient space so that radiation is not limiting. In the field, the major drawback is the heterogeneous nature of soil salinity and other soil constraints.
Screening for a trait associated with a specific mechanism is preferable to screening for salinity tolerance itself. Screening for specific traits can reduce the time needed to grow plants in salinity, and can eliminate the need to grow plants under control conditions, thus making savings on glasshouse space and labour.
The importance of traits
Because of the complex nature of salinity tolerance, as well as the difficulties in maintaining long-term growth experiments, we recommend trait-based selection criteria for screening techniques. Specific traits are less subject to environmental influence than growth rates.
Further, this allows for different traits to be pyramided, especially when molecular markers for specific traits have been identified.
Traits for salt-specific effect
Salt exclusion
The most successful trait in terms of plant breeding relates to rates of Na+ or Cl– accumulation in leaves, measured as the increase in salt in a given leaf over a fixed period of time. This trait has a high heritability and has been used to develop cultivars of rice, white clover, and lucerne with increased tolerance to saline soil. Sometimes K+/Na+ discrimination instead of Na+ exclusion is used for screening, however the uptake of K+ and the resultant K+/Na+ discrimination may be the result of genetic differences in the regulation of Na+ uptake, and not independent of it. If so, there is nothing to be gained by measuring K+ as well as Na+.
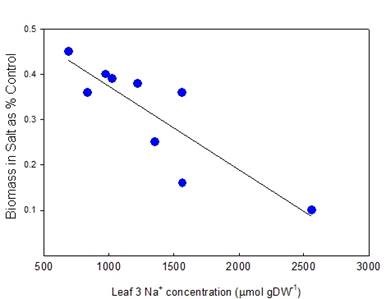
A correlation between Na+ or Cl– accumulation and salinity tolerance is found in most species, however not all species contain significant genetic variation in Na+ or Cl– accumulation. Durum wheat is one species in which there is significant genetic variation in Na+ but not Cl– uptake. Genotypes with low Na+ uptake are more salinity tolerant, as indicate by greater biomass production over 1-2 months in saline solution, in comparison to non-saline solution (Fig. 3). In some species, Na+ is retained in roots and stems in exchange for K+, and only Cl– progresses through to the leaves, balanced by K+. In those cases, Cl– exclusion correlates with salinity tolerance.
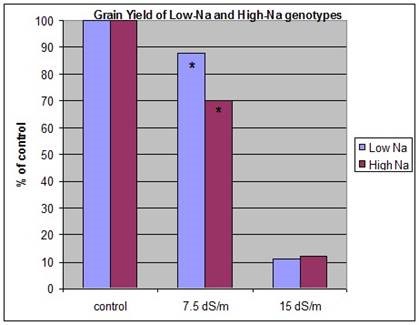
Proving that Na+ (or Cl–) exclusion confers salinity tolerance in terms of yield is not so easy. A comparison between durum landraces with very low and very high rates of Na+ accumulation showed that, at moderate salinity, the yield of genotypes with low Na+ was greater than those with high Na+, but at high salinity there was no yield advantage. The osmotic effect of the salinity then dominated (Fig. 4).
Tissue tolerance
Tissue tolerance, i.e. tolerance of high internal Na+ concentrations, cannot be measured directly, and is difficult to quantify. Yet it is clearly important; overexpression of the vacuolar Na+/H+ antiporter that sequesters Na+ in vacuoles (NHX1) improved the salinity tolerance of Arabidopsis, tomato and brassica (see next section).
Tolerance of high internal Na+ levels is evidenced by an absence of leaf injury despite high leaf concentrations of Na+. Concentrations of Na+ above 100 mM will start to inhibit most enzymes, so when tissue concentrations are over 100 mM, which corresponds to about 0.5 mmol g-1 DW (assuming a leaf water content of 5 g H2O g-1 DW), the Na+ must be compartmentalised in vacuoles, and be a higher concentration there than in the cytoplasm.
Halophytes have the ability to compartmentalise Na+ to very high concentrations in vacuoles. Halophytes have no special metabolic adaptation to high salinity. Early studies showed that in vitro activities of enzymes extracted from the halophytes Atriplex spongiosa and Suaeda maritima were just as sensitive to NaCl in the assay media as were enzymes extracted from the common bean or green pea. So their ability to tolerate Na+ levels as great as 3.5 mmol g-1 DW (about 700 mM) is due to their ability to compartmentalise most of the Na+ in vacuoles (Flowers et al., 1977).
Glycophytes are able to compartmentation Na+ in vacuoles to some extent, as levels of Na+ up to 1 mmol g-1 DW (200 mM) are quite common in photosynthetically active leaves of many species. In a study in wheat genotypes, Na+ became potentially toxic only when leaf concentrations exceeded 1.25 mmol g-1 DW (250 mM), as judged by the onset of non-stomatal reductions in photosynthesis in durum wheat at this concentration (James et al, 2002).
There may be genetic variation for tolerance of high internal Na+ concentrations in many species, as indicated by ‘out-lyers’ in correlations between leaf Na+ concentrations and salinity tolerance. This has been found in rice and wheat and probably many other species. However, quantitative assess of the genetic variation is difficult. The trait is characterised by leaf longevity, lack of necrosis, and prolonged growth despite very high accumulation of Na+. A recent paper describes the success or failure of various methods to screen durum wheat for genetic variation in tolerance of high internal Na+ (Munns and James 2003). The degree of leaf death was measured as an indicator of Na+ toxicity. Leaf injury, however could arise from a number of reasons. First there would be the osmotic effects of salt in the soil solutions, causing accelerated senescence due to leaf water deficit or hormonal effects arising from root signals. Second, there could be nutrient imbalances resulting in deficiencies or excesses of other ions. Third, there could be dehydrating effects of salts building up in the cell walls. A phenotype other than leaf injury is needed to distinguish between genotypes with different degrees of tissue tolerance. The onset of non-stomatal reductions in photosynthesis mentioned above is a possible phenotype.
Table 3 summarises the features of salt-specific traits, along with traits for the osmotic effect of salinity.
Table 3. List of possible techniques used to screen for salinity tolerance (adapted from Munns and James 2003) | |||||
TechniqueA | Osmotic or salt-specific effect measured | Controls needed | Advantages (speed, dependence on controlled conditions etc.) | Length of time of experiment | Correlation with tolerance in field |
Whole plant growth measurements – biomass – RGR – RGR in salinity alone | Osmotic or both | Yes Yes No** | Closest measure of salinity tolerance in the field, and an indicator of yield. | 4-6 weeks | Moderate |
Root elongation | Osmotic | Yes | Quick, does not require controlled environment. | 1-2 weeks | Low |
Leaf elongation | Osmotic | Yes | Non-destructive | 2 weeks | Low |
Germination | Osmotic | Yes | Large numbers easily handled | 1 week | Low or none |
Survival | Either or both | No* | Limited experimental period, as can adjust the salinity. Highly tolerant genotypes stand out. | 2-8 weeks, depending on salinity | Uncertain, and counter-productive for annual crops |
Leaf injury – leakage from discs – chlorophyll content | Either or both | No* | Non-destructive | 2-4 weeks | Unproven |
Chlorophyll fluorescence | Either or both | No* | Non-destructive, can do in field | 2-8 weeks | Unproven |
Tissue culture | Either or both | Yes | Months | None | |
Salt-specific traits – Na+ exclusion – K+/Na+ discrimination – Cl– exclusion – tissue tolerance | Salt-specific | No No No No** | Non-destructive | 1-2 weeks 1-2 weeks 1-2 weeks 2-6 weeks | High High High Unknown |
* assumes plants do not vary in the control treatment, either between genotypes or between experiments. There should be 100% survival, no leakage, and typical F parameters of healthy plants. ** assumes that RGR and leaf longevity in controls conditions does not vary between genotypes – this is likely, but needs to be verified | |||||
Traits for the osmotic effect
Measurements of growth, survival, leaf gas exchange and germination will indicate the osmotic effect of salinity. If the experiments are conducted for lengthy periods of time, measurements of growth, survival and gas exchange will also reflect toxic effects of salts in the leaves.
Growth can be measured as leaf elongation, root elongation, leaf area expansion, or shoot biomass. Of these indices of growth, leaf area expansion or shoot biomass are the most sensitive and comprehensive, as this includes production of tillers or lateral shoots. The number of lateral shoots is more sensitive to water stress than the elongation rate of any given leaf.
Gas exchange characters are stomatal conductance (including infra-red temperature), photosynthesis, transpiration efficiency (including carbon isotope discrimination), and chlorophyll fluorescence. For screening larger numbers of genotypes, traits related to stomatal conductance are the most feasible. Chlorophyll fluorescence as an indicator of photosynthetic activity was assessed by James et al (2002). They found that the simplest parameter, Fv/Fm, was no more sensitive than chlorophyll content itself. The quenching parameters, such as NPQ, did indicate a reduction in photosynthetic capacity before chlorophyll itself started to degrade (James et al. 2002), but these parameters require both light and dark-adapted readings and are not feasible for large numbers of genotypes.
Leaf injury can be quantified by a number of methods such as chlorophyll content, or electrolyte leakage of cut discs. Chlorophyll content can be measured with a SPAD meter.
Turgor and osmotic adjustment are also indicators of leaf injury and photosynthetic capacity.
All these methods are used also for drought tolerance.
Whole plant survival at high salinity may reflect the salt-specific effect rather than the osmotic effect, as the plant’s ability to control salt uptake may break down at high salinity.
Germination is easy to measure, but little or no relation between salinity tolerance at germination and that of the seedling or adult plant has been found in any species examined.
These methods are summarised in Table 3
- Molecular approaches to achieve salinity tolerance:
Gene transformation
Significant advances in the field of molecular biology technology have been made during the past decade. The use of molecular techniques to selectively introduce desired genes may provide alternative ways to classical plant breeding to achieve salinity tolerance. These techniques will benefit the development of salinity-tolerant cultivars based on specific traits that are controlled by one gene, eg a transcription factor or an important ion channel. The work of Blumwald and colleagues (e.g. Zhang and Blumwald, 2001) shows the progress made by using molecular technology. The authors reported the development of a salinity tolerant transgenic tomato plant in which over-expression of the vacuolar Na+/H+ antiporter shows dramatic improvement of vegetative growth and of fruit yield. This antiporter is the only known transporter that would compartmentalise Na+ in the vacuole, where Na+ has little chance of toxic effect on metabolism, or to be transported to younger leaves and fruits. These studies indicate great potential for transgenic methodology, but so far the evidence of the mechanism is not proven.
Flowers (2004) has questioned the current ‘hype’ (hyperbole) involving transgenics and concluded that so far no useful increase in salinity tolerance has been achieved. A number of genes, encoding proteins with known functions in ion transport or in synthesis of compatible organic solutes, as well as genes whose functions are not fully understood, have been used to transform a number of species in efforts to improve salinity tolerance. Despite numerous claims of improved salinity tolerance, poor experimental designs and choices of parameters measured to evaluate tolerance mean that much doubt remains. None of these transgenics has been proven in the field. Since salinity tolerance is a multigenic trait, large improvements based on modification of only one gene could only occur if the gene is a transcription factor and regulates a number of genes that control ion transport or some other process involved in salinity tolerance.
Given the natural diversity that exists, and given the current social antipathy to genetically-engineered crops, it might be more realistic to consider using the genes identified as perfect markers for naturally-occurring diversity.
Molecular markers
The development of molecular markers for physiological traits has made significant headway in recent years with the advancement of new technologies. Consequently, the use of molecular markers in breeding programs is increasing rapidly as they have been shown to greatly improve the efficiency of the breeding programs. Marker-assisted selection is non-destructive and can provide information on the genotype of a single plant without exposing the plant to the stress. The technology is capable of handling large numbers of samples. PCR-based molecular markers have the potential to reduce the time, effort and expense often associated with physiological screening. In order to use marker-assisted selection in breeding programs, the markers must be closely linked to the trait, and work across different genetic backgrounds.
The development of robust markers that are reliable across a wide range of backgrounds can be quite difficult, and is entirely dependent on an accurate phenotype screen. Understanding the physiology of sodium uptake is critical to the development of a reliable and accurate phenotype test, and thereby to the identification of a QTL (Quantitative Trait Locus) and a molecular marker linked to the locus.
QTL mapping and marker-assisted selection is a technique that has many advantages over phenotypic screening as a selection tool. The efficiency of genetic mapping has improved greatly in recent years, with the advent of high-density maps incorporating microsatellite markers, RFLP markers, and population-specific polymorphic fragments identified by the AFLP technique. The approach has been widely used to successfully map agronomic traits in a variety of cereal species. Although developing a suitable population for QTL analysis is laborious, and identifying a QTL is expensive, the markers that are linked to the QTL may be sufficient to use as the sole selection tool for a specific trait in a breeding program. QTLs for salinity tolerance have been described in several cereal species, including rice, barley and wheat. However, these studies have not yet yielded robust markers that can be used across a range of germplasm, significant associations between the trait and the marker being confined to the populations in which they were derived. The success of these studies could be limited by the small amount of genetic diversity present within modern cultivars, and the use of parental lines with small differences in the traits.
- Perennials, halophytes and reclamation plants
When land becomes salinized it is abandoned. Over the last decade, efforts have been made to reclaim salinized land for some sort of economic return. Halophytic plants have been investigated for this purpose. Halophytes are the native flora of saline soils, and can complete their life cycle at salinities above 250 mM NaCl. Most halophytes need at least 1 mM NaCl to grow well, many need 10-50 mM NaCl to reach maximum growth, and a few grow best at 200-300 mM NaCl (Flowers et al., 1986). Many halophytes are very slow-growing even at their optimal salinity, but a few are suitable for reclamation. For instance, tall wheat grass (Thinopyrum ponticum, a decaploid form of Agropyrum elongatum) is widespread in many continents and now planted as a fodder species in saline soil. Another species being planted for fodder is the dicotyledenous halophyte, Atriplex amnicola, a saltbush species native to Western Australia. Some halophytes are more tolerant than this, but A. amnicola shows the growth maximum at low salinity and the extended growth at very high salinities that is typical of many dicotyledenous halophytes.
Recently there has been strong interest in the salinity tolerance of trees that are not halophytes but have good salinity tolerance and high transpiration rates that can be planted in saline soils to lower water tables. Such species need also to be tolerant of waterlogging as secondary salinity occurs with rising water tables, so the ability to withstand periods of waterlogging and to continue high transpiration rates is essential. In Australia, river red gum (Eucalptus camaldulensis) has been the most widely used. However, there are a number of other species that are better able to tolerate saline and waterlogged soils. Many Acacia, Casuarina and Melaleuca species are tolerant of high salinity; for example, A. stenophylla did not suffer a 50% growth reduction until an ECe of 20 dS m-1, equivalent to about 200 mM NaCl (Marcar et al., 1995). Such species are recommended for reclamation of land that has become saline because of irrigation, as they provide some income to farmers as fodder and fuelwood.
Conclusions
There is abundant unexplored and unexploited genetic variation that can be harnessed to improve the salt tolerance of crop and horticultural species. This avoids the need for genetic engineering involving transformation with a single gene, which has both sociological problems in the current attitude to transgenic food, and also physiological limitations as salt tolerance is a complex process and many genes are controlling it.
Increases in the salinity tolerance of crops and pasture plants can overcome some of the impacts of salinity in areas not associated with rising water tables. Where there is a high water table, plants need to be tolerant of waterlogging as well as of salinity.
Solutions to salinity depend on lowering water tables, which means that plants should use as much water as possible, and use all the rain or irrigation water. Management of salinity includes planting perennials in areas identified as recharge areas. Salinity tolerance is not an important character for these plants, rather deep roots and efficient water extraction is more important.
Long-term solutions to salinity involve changed farming systems and a changed attitude to using water. Water-inefficient crops such as rice might give way to water-efficient crops such as alfalfa (lucerne). In catchments with rising water tables, solutions will also depend on social, economic, and political factors, and an acceptance that old ways have to change if agriculture is to be sustained.
References
Black AL, Brown PL, Halvorson AD, Siddoway FH (1981) Dryland cropping strategies for efficient water-use to control saline seeps in the Northern Great Plains, U.S.A. Agricultural Water Management 4, 295-311.
Flowers TJ (2004) Improving crop salt tolerance. Journal of Experimental Botany 55, 307-319.
Flowers TJ, Troke PF, Yeo, AR (1977) The mechanism of salt tolerance in halophytes. Annual Review of Plant Physiology, 28, 89-121.
Goyal SS, Sharma SK, Rains DW, Lauchli A (1999a) Long term reuse of drainage waters of varying salinities for crop irrigation in a cotton-safflower rotation system in the San Joaquin Valley of California – A nine year study: I. Cotton (Gossypium hirsutum L.). Journal of Crop Production 2, 181-213.
Goyal SS, Sharma SK, Rains DW, Lauchli A (1999b) Long term reuse of drainage waters of varying salinities for crop irrigation in a cotton-safflower rotation system in the San Joaquin Valley of California – A nine year study: II. Safflower (Carthamus tinctorius L.). Journal of Crop Production 2, 215-227.
Hutchinson PA, Bond WJ (2001) Routine measurement of the soil water potential gradient near saturation using a pair of tube tensiometers. Australian Journal of Soil Research 39, 1147-1156.
Husain S, Munns R, Condon AG (2003) Effect of sodium exclusion trait on chlorophyll retention and growth of durum wheat in saline soil. Australian Journal of Agricultural Research 54, 589–597.
James RA, Rivelli AR, Munns R, von Caemmerer S (2002) Factors affecting CO2 assimilation, leaf injury and growth in salt-stressed durum wheat. Functional Plant Biology 29, 1393-1403.
Munns R (1993) Physiological processes limiting plant growth in saline soils. Some dogmas and hypotheses. Plant Cell and Environment 16, 15–24.
Munns R (2002) Comparative physiology of salt and water stress. Plant, Cell and Environment 25, 239-250.
Munns R, James RA (2003) Screening methods for salinity tolerance: a case study with tetraploid wheat. Plant and Soil 253, 201-218.
Munns R, Schachtman DP, Condon AG (1995) The significance of two-phase growth response to salinity in wheat and barley. Australian Journal of Plant Physiology 22, 561–569.
Passioura JB, Munns (2000) Rapid environmental changes that affect leaf water status induce transient surges or pauses in leaf expansion rate. Australian Journal of Plant Physiology 27, 941-948.
Qureshi R H, Aslam M, Akhtar J (2003) Productivity enhancement in the salt-affected lands of Joint Satiana Pilot Project area of Pakistan. In SS Goyal, SK Sharma, DW Rains (Eds) Crop Production in Saline Environments: Global and Integrative perspectives. The Food Products Press, Binghamton, New York.
Richards L A (Ed) (1969) Diagnosis and improvement of saline and alkali soils. Agriculture Handbook No. 60, United States Department of Agriculture, Washington DC.
Stirzaker RJ, Vertessy RA, Sarre A (Eds) (2002) Trees, Water and Salt: An Australian guide to using trees for healthy catchments and productive farms. Rural Industries Research and Development Corporation: Canberra.
Zhang HX, Blumwald E (2001) Transgenic salt-tolerant tomato plants accumulate salt in foliage but not in fruit. Nature Biotechnology 19, 765-768.