- The Environmental and Physiological Nature of Salinity
Introduction
According to the FAO Land and Plant Nutrition Management Service, over 6% of the world’s land is affected by either salinity or sodicity (Table 1). The term salt-affected refers to soils that are saline or sodic, and these cover over 400 million hectares, which is over 6% of the world land area (Table 1). Much of the world’s land is not cultivated, but a significant proportion of cultivated land is salt-affected. Of the current 230 million ha of irrigated land, 45 million ha are salt-affected (19.5 percent) and of the 1,500 million ha under dryland agriculture, 32 million are salt-affected to varying degrees (2.1 percent).
Table 1: Regional distribution of salt-affected soils, in million hectares | |||||
Regions | Total area | Saline soils | Sodic soils | ||
Mha | Mha | % | Mha | % | |
Africa | 1,899 | 39 | 2.0 | 34 | 1.8 |
Asia, the Pacific and Australia | 3,107 | 195 | 6.3 | 249 | 8.0 |
Europe | 2,011 | 7 | 0.3 | 73 | 3.6 |
Latin America | 2,039 | 61 | 3.0 | 51 | 2.5 |
Near East | 1,802 | 92 | 5.1 | 14 | 0.8 |
North America | 1,924 | 5 | 0.2 | 15 | 0.8 |
Total | 12,781 | 397 | 3.1% | 434 | 3.4% |
Source: FAO Land and Plant Nutrition Management Service | |||||
Salinity occurs through natural or human-induced processes that result in the accumulation of dissolved salts in the soil water to an extent that inhibits plant growth. Sodicity is a secondary result of salinity in clay soils, where leaching through either natural or human-induced processes has washed soluble salts into the subsoil, and left sodium bound to the negative charges of the clay.
A saline soil is defined as having a high concentration of soluble salts, high enough to affect plant growth. Salt concentration in a soil is measured in terms of its electrical conductivity, as described in the section below on measurements. The USDA Salinity Laboratory defines a saline soil as having an ECe of 4 dS/m or more. ECe is the electrical conductivity of the ‘saturated paste extract’, that is, of the solution extracted from a soil sample after being mixed with sufficient water to produce a saturated paste. However, may crops are affected by soil with an ECe less than 4 dS/m. The moisture content of a drained soil at field capacity may be much lower than the water content of its saturated paste. Further, under dryland agriculture, the soil water content might drop to half of field capacity during the life of the crop. The actual salinity of a rain-fed field whose soil had an ECe of 4 dS/m could be 8-12 dS/m. As described below, this would severely limit yield of most crops.
Types and Causes of Salinity
Natural or primary salinity
Primary salinity results from the accumulation of salts over long periods of time, through natural processes, in the soil or groundwater. It is caused by two natural processes.
The first is the weathering of parent materials containing soluble salts. Weathering processes break down rocks and release soluble salts of various types, mainly chlorides of sodium, calcium and magnesium, and to a lesser extent, sulphates and carbonates. Sodium chloride is the most soluble salt.
The second is the deposition of oceanic salt carried in wind and rain. ‘Cyclic salts’ are ocean salts carried inland by wind and deposited by rainfall, and are mainly sodium chloride (Table 2). Rainwater contains from 6 to 50 mg/kg of salt, the concentration of salts decreasing with distance from the coast. If the concentration is 10 mg/kg, this would add 10 kg/ha of salt for each 100 mm of rainfall per year. Accumulation of this salt in the soil would be considerable over millennia. The amount of salt stored in the soil varies with the soil type, being low for sandy soils and high for soils contain a high percentage of clay minerals. It also varies inversely with average annual rainfall. For example, in Western Australia, the salt content of a 40 m profile ranges from 170 to 950 tonne/ha for rainfall averaging from 1000 mm to 600 mm per year.
Table 2: Concentration of salts in rain and seawater. | ||||
The composition of rainwater varies greatly depending on prevailing winds and distance from the coast, and the table gives the composition of rainwater from a northern hemisphere source (Encyclopaedia Britannica). It is measured as mg/kg or ppm (parts per million). The composition of seawater is uniform around the globe, and is expressed as g/kg or ppt (parts per thousand). The electrical conductivity of rainwater is about 0.01 dS/m, and of seawater is 55 dS/m. | ||||
Ion | rainwater (local) | seawater (global) | ||
mg/kg (ppm) | (µmol/L) µM | g/kg (ppt) | (mmol/L) mM | |
Sodium (Na+) | 2.0 | 86 | 10.8 | 470 |
Chloride (Cl–) | 3.8 | 107 | 19.4 | 547 |
Sulfate (SO4 2-) | 0.6 | 6 | 2.7 | 28 |
Magnesium (Mg2+) | 0.3 | 11 | 1.3 | 53 |
Calcium (Ca2+) | 0.1 | 2 | 0.4 | 10 |
Potassium (K+) | 0.3 | 8 | 0.4 | 10 |
Total | 7.0 | 35.0 | ||
Secondary or human-induced salinity
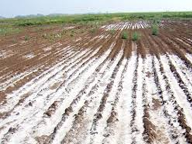
Secondary salinisation results from human activities that change the hydrologic balance of the soil between water applied (irrigation or rainfall) and water used by crops (transpiration). The most common causes are (i) land clearing and the replacement of perennial vegetation with annual crops, and (ii) irrigation schemes using salt-rich irrigation water or having insufficient drainage. Prior to human activities, in arid or semi-arid climates, the water used by natural vegetation was in balance with the rainfall, with the deep roots of native vegetation ensuring that the water tables were well below the surface. Clearing and irrigation changed this balance, so that rainfall on the one hand, and irrigation water on the other, provided more water than the crops could use. The excess water raises water table and mobilises salts previously stored in the subsoil and brings them up to the root zone. Plants use the water and leave the salt behind until the soil water becomes too salty for further water uptake by roots. The water table continues to rise, and when it comes close to the surface, water evaporates leaving salts behind on the surface and thus forming a ‘salt scald’. The mobilised salt can also move laterally to water courses and increase their salinity.
Irrigated lands of the world in 1987 totalled 227 Mha (Table 3). In many irrigated areas, the water table has risen due to excessive amounts of applied water coupled with poor drainage. In most of the irrigation projects located in semi-arid and arid areas, the problems of waterlogging and soil salinity have reached serious proportions even before the full potential of the irrigation project could be realised. Most of the irrigation systems of the world have caused secondary salinity, sodicity or waterlogging. Table 3 shows that the proportion of salt-affected irrigated land in various countries ranges from a minimum of 9% to a maximum of 34%, with a world average of 20%. Irrigated land is only 15% of total cultivated land, but as irrigated land has at least twice the productivity of rainfed land, it may produce one-third of the world’s food.
Table 3: Global estimate of secondary salinisation in the world’s irrigated lands | |||||
Country | Total land area cropped Mha | Area irrigated | Area of irrigated land that is salt-affected | ||
Mha | % | Mha | % | ||
China | 97 | 45 | 46 | 6.7 | 15 |
India | 169 | 42 | 25 | 7.0 | 17 |
Soviet Union | 233 | 21 | 9 | 3.7 | 18 |
United States | 190 | 18 | 10 | 4.2 | 23 |
Pakistan | 21 | 16 | 78 | 4.2 | 26 |
Iran | 15 | 6 | 39 | 1.7 | 30 |
Thailand | 20 | 4 | 20 | 0.4 | 10 |
Egypt | 3 | 3 | 100 | 0.9 | 33 |
Australia | 47 | 2 | 4 | 0.2 | 9 |
Argentina | 36 | 2 | 5 | 0.6 | 34 |
South Africa | 13 | 1 | 9 | 0.1 | 9 |
Subtotal | 843 | 159 | 19 | 29.6 | 20 |
World | 1,474 | 227 | 15 | 45.4 | 20 |
Source: Ghassemi et al. (1995) compiled from FAO data for 1987 | |||||
Irrigation water adds appreciable amounts of salt, even with good quality irrigation water containing only 200-500 mg/kg of soluble salt. Irrigation water with a salt content of 500 mg/kg (i.e. 500 mg/L) contains 0.5 tonnes of salt per 1,000 m3. Since crops require 6,000-10,000 m3 of water per hectare each year, one hectare of land will receive 3-5 tonnes of salt. Because the amount of salt removed by crops is negligible, salt will accumulate in the root zone, and must be leached by supplying more water than is required by the crops. If drainage is not adequate, the excess water causes the water table to rise, mobilising salts which accumulate in the root zone. When the crop is unable to use all the applied water, waterlogging occurs.
Land clearing also changes the hydrological balance. In its natural state, native deep-rooted and perennial vegetation use almost all the rainwater that falls on the land. In arid or semi-arid climates, the growth rate of the natural vegetation is limited by the availability of fresh rainwater. Salts will be flushed down by rain, and accumulate at the bottom of the root zone to the limiting concentration for roots to extract water, at approximately 50 dS/m. Clearing the deep-rooted native vegetation, and replacing it with shallow-rooted annual species that do not use all the rainfall, allows rainwater to escape below the roots, and ‘recharge’ the groundwater. Clearing of native vegetation for dryland agriculture can increase the rate of drainage by 100 times. In the Mallee Region of southern Australia, measurements show that drainage under native mallee vegetation is only 0.1 mm per year, but under annual crops it is 10 mm per year. This additional rainwater enters the groundwater or aquifers, causing the watertable to rise. In Australia, 2 Mha of land have been damaged by rising watertables due to land clearing, and another 15 Mha are at risk of salinisation by rising watertables over the next 50 years. (Data from Australian National Land and Water Resources).
Soil sodicity and sub-soil salinity
Sodic soils have a low concentration of soluble salts, but a high percent of exchangeable Na+; that is, Na+ forms a high percent of all cations bound to the negative charges on the clay particles that make up the soil complex. Sodicity is defined in terms of the threshold ESP (exchangable sodium percentage) that causes degradation of soil structure. The negatively charged clay particles are held together by divalent cations. When monovalent cations such as Na+ displace the divalent cations on the soil complex, and the concentration of free soluble salts is low, the complex swells and the clay particles separate (‘disperse’). The USDA Salinity Laboratory defines a sodic soil as having an ESP greater than 15, but in Australia it is considered sodic when the ESP is greater than 6. This lower threshold is due to Australian soils having a low content of other soluble cations, particularly Ca2+, which help to stabilise clay colloids during leaching.
If the concentration of soluble salts is sufficiently low, hydrolysis of the sodic clay will occur, creating a highly alkaline soil. Alkaline soils are a type of sodic soil with a high pH due to carbonate salts, and are defined as having an ESP of 15 or more with a pH of 8.5-10.
The process of sodicity is complex and occurs over a long period of time. Initially, salts that have accumulated within the soil profile, from either airborne deposition or mineral weathering, cause the clay fraction of the soil to become saturated with sodium. Subsequently, leaching of the profile, either by rainwater over prolonged periods, or by irrigation with fresh water, lowers the electrolyte concentration and the clay particles disperse. Further leaching washes the dispersed clay particles deeper into the profile where they block pores and hinder infiltration of water. The soil then is very slow to drain, and is readily waterlogged.
In semi-arid environments, soil profiles are commonly saline/sodic, where the salt has accumulated due to the low permeability of the sodic subsoil. In theory, if sufficient salts accumulate, the threshold electrolyte concentration for flocculation will be exceeded and the clay will flocculate and take on pseudo-structure. However, given that permeability and leaching will then increase, the subsequent dilution of salts will cause colloids to disperse. Consequently, a quasi-steady state between flocculation and dispersion processes is maintained.
Saline/sodic soils are widespread in arid and semi-arid lands of the world (Table 3), with a large component in Australia (over 250 million ha). Water infiltration is slow, and salts derived from rainfall or weathering reactions accumulate in saturated zones in the subsoil. The term ‘transient salinity’ denotes the seasonal and spatial variation of salt accumulation in the root zone not influenced by groundwater processes and rising water table (Rengasamy, 2002). This transient salinity fluctuates in depth, due mainly to seasonal rainfall patterns. Transient salinity is extensive in many landscapes dominated by subsoil sodicity. Probably, two thirds of the agricultural area of Australia has a potential for transient salinity not associated with groundwater (Rengasamy, 2002).
- Measuring soil salinity
Soil salinity is measured by its electrical conductivity. The SI unit of electrical conductivity (EC) is dS/m. Table 4 shows the relationship to other units of conductivity, and to NaCl concentration (10 mM NaCl has an EC close to 1 dS/m). Originally the conductivity was measured in a saturated paste extract (ECe), but the method is tedious as first the saturated paste has to be made, second the water needs to be extracted by a powerful vacuum pump, and third a very sandy soil does not make a saturated paste. A more convenient and universal method is a ‘1:5 extract’. The soil is dried or compressed, shaken with 5 g deionised water per 1 g soil, the probe of a hand-held conductivity meter is placed in the suspension, and the EC measured. The EC of the soil that was sampled can be calculated if its water content is known at the time of sampling. Alternatively, the measurement can be related to the field capacity of the soil using conversion factors. As a rough guide, a sandy soil will have a field capacity of 0.2 g water per g soil, and a clay soil about 0.4 g/g.
Table 4: Units for measuring salinity, and conversion factors. | |||
Conversion factors relating total dissolved salts or pure NaCl to an electrical conductivity (EC) of 1 dS/m (1 deciSiemen/metre) are given, along with equivalent units of various types, old and new. The conversion of EC of 1 dS/m to total dissovled salts (640 mg/L) assumes a composition of salts that is common in groundwater across the world. The exact factor varies from 530 (if the salt is predominantly NaCl) to 900 (if the salts are formed predominantly from divalent ions). | |||
Measurement and units | Application | 1 dS/m is equal to: | Equivalent units |
Conductivity (dS/m) | soils | 1 | 1 dS/m = 1 mS/cm = 1 mmho/cm |
Conductivity (µS/cm) | irrigation and river water | 1000 µS/cm | 1 µS/cm = 1 µmho/cm |
Total dissolved salts (mg/L) | irrigation and river water | 640 mg/L (approx.) | 1 mg/L = 1 mg/kg = 1 ppm |
Molarity of NaCl (mM) | laboratory | 10 mM | 1 mM = 1 mmol/L |
Table 5: Electrical conductivity (EC) of pure solutions at 20°C (dS/m). | |
The solutions represent those of salts found in soils or in seawater. Data from the Handbook of Physics and Chemistry (CRC Press, 55th editition, 1975). (Note that 1 dS/m = 1 mmho/cm). | |
Solution | EC (dS/m) |
10 mM NaCl | 1.0 |
100 mM NaCl | 9.8 |
500 mM NaCl | 42.2 |
10 mM KCl | 1.2 |
10 mM CaCl2 | 1.8 |
10 mM MgCl2 | 1.6 |
50 mM MgCl2 | 8.1 |
The electrical conductivity of irrigation or river water is measured with the same hand-held conductivity meter as above, but is expressed in units 1000 times magnified, as channel or river water would normally have a very low concentration of salts. River water quality is often expressed as dS/cm (1000 x dS/m). Irrigation water quality is often expressed as total soluble salts, an international convention being that 1 dS/m is equivalent to 640 mg/L of mixed salts (Table 4).
Some data on the electrical conductivity of pure solutions relevant to saline soils or to seawater are given in Table 5. As 10 mM NaCl has an EC of almost exactly 1.0 dS/m, and as it is the most common salt in solution in ground or river water, a ‘rule of thumb’ is to muliply the EC by ten to equate it to salt molarity.
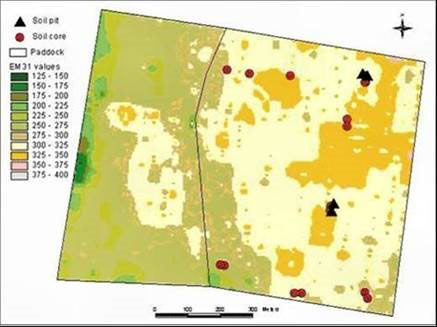
Soil salinity on a large scale is mapped with an electromagnetic (EM) conductivity meter. This instrument estimates the bulk electrical conductivity of the soil, which depends on the salinity of the soil solution, its water content, and the type and amount of clay in the soil. The output needs to be calibrated by chemical measurements of cores taken from the field. The ground EM conductivity meters consist of a small transmitter coil, energised with an alternative current. This current generates a primary magnetic field in the ground, which induces small currents which generate their own secondary magnetic field, which is smaller and proportional to the soil conductivity. A receiver coil close by measures the primary and secondary magnetic fields. The EM38 meter (Geonics Limited) is designed for agricultural surveys and measures to 1.5 m depth in the vertical mode and 0.75 m in the horizontal mode. An EM38 survey can be used to map the extent of subsoil salinity as well as discharge areas. Fig 1 illustrates the heterogeneity of soil salinity as shown by the EM meter.
Airborne EM mapping is feasible now that global positioning systems have become available for accurate and rapid mapping. In the airborne method, the transmitter is slung below a plane flying at 150 m, and the receiver is towed behind. The plane generates a magnetic field, and the moving field passsing through the ground creates a secondary electric field whenever it hits something conductive. The receiver trailing behind the plane collects the data (For example, the Australian National Airborne Physics Project).
- The repercussions of salinity
The Effect of Salinity on Plants
Salts in the soil water may inhibit plant growth for two reasons. First, the presence of salt in the soil solution reduces the ability of the plant to take up water, and this leads to reductions in the growth rate. This is referred to as the osmotic or water-deficit effect of salinity. Second, if excessive amounts of salt enter the plant in the transpiration stream there will be injury to cells in the transpiring leaves and this may cause further reductions in growth. This is called the salt-specific or ion-excess effect of salinity (Greenway and Munns, 1980). The definition of salt tolerance is usually the percent biomass production in saline soil relative to plants in non-saline soil, after growth for an extended period of time. For slow-growing, long-lived, or uncultivated species it is often difficult to assess the reduction in biomass production, so percent survival is often used.
As salinity is often caused by rising water tables, it can be accompanied by waterlogging. Waterlogging itself inhibits plant growth and also reduces the ability of the roots to exclude salt, thus increasing the uptake rate of salt and its accumulation in shoots. More information on waterlogging stress can be found on this web site under ‘The Stresses’.
Variation in Salt Tolerance between Species
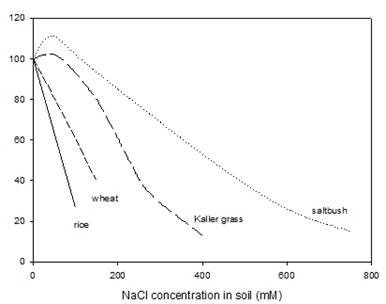
The three most important crops in the world are wheat, rice and maize. Differences in the growth response of various species are shown in Fig. 2. Wheat is one of the more salt-tolerant crop species, and many cultivars that have been selected for yield in water-limited conditions do not suffer a 50% reduction in biomass until salinities reach 15 dS/m (approximately 150 mM NaCl). Rice is more salt-sensitive, and many cultivars suffer a 50% reduction in growth at half this concentration of salts. Maize falls in between these two species in terms of salt sensitivity.
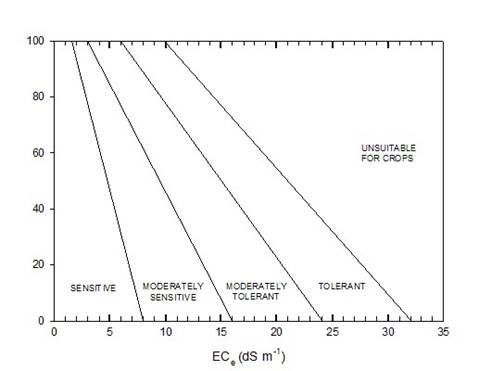
Another criterion of salt tolerance of crops is their yield in saline versus non-saline conditions. A survey of salt tolerance of crops, vegetables and fruit trees was made by the USDA Salinity Laboratory. This shows for each species a threshold salinity below which there is no reduction in yield, and then a regression for the reduction in yield with increasing salinity (Fig. 3). Full details are available on line. The data in some cases are for a single cultivar of the species, or a limited number of cultivars at a single site, so they are not necessarily representative of the species. Further, the data are related to an ECe value, which is not an appropriate reference point for a sandy soil, or for many current soil salinity estimates that based merely on a 1:5 extract. However, the data are useful in that they show the wide range of tolerance across species, and also show that yield has a different pattern of response than does vegetative biomass (compare with Fig. 2) Yield always shows a threshold in response to a range of salinities (Fig 3), but with young plants a threshold is rarely seen. With plants exposed to salinity at an early stage of seedling development there are linear reductions in both leaf area expansion and total plant biomass with increasing salinity, as shown in Fig. 2.
Causes of the Growth Reduction under Saline Conditions
The effects of a saline soil are two-fold: there are effects of the salt outside the roots, and there are effects of the salt taken up by plants.
The salt in the soil solution (the “osmotic stress”) reduces leaf growth and to a lesser extent root growth, and decreases stomatal conductance and thereby photosynthesis (Munns, 1993). The cellular and metabolic processes involved are in common to drought-affected plants, and described under Drought Stress and Its Impact on this site. The rate at which new leaves are produced depends largely on the water potential of the soil solution, in the same way as for a drought-stressed plant. Salts themselves do not build up in the growing tissues at concentrations that inhibit growth: meristematic tissues are fed largely by the phloem from which salt is effectively excluded, and rapidly elongating cells can accommodate the salt that arrives in the xylem within their expanding vacuoles. So, the salt taken up by the plant does not directly inhibit the growth of new leaves.
The salt within the plant enhances the senescence of old leaves. Continued transport of salt into transpiring leaves over a long period of time eventually results in very high Na+ and Cl– concentrations, and they die. The rate of leaf death is crucial for the survival of the plant. If new leaves are continually produced at a rate greater than that at which old leaves die, then there might be enough photosynthesising leaves for the plant to produce some flowers and seeds. However, if the rate of leaf death exceeds the rate at which new leaves are produced, then the plant may not survive to produce seed. For an annual plant there is a race against time to initiate flowers and form seeds, while the leaf area is still adequate to supply the necessary photosynthate. For perennial species, there is an opportunity to enter a state of dormancy, and thus survive the stress.
The two responses occur sequentially, giving rise to a two-phase growth response to salinity. The first phase of growth reduction is quickly apparent, and is due to the salt outside the roots. It is essentially a water stress or osmotic phase, for which there is surprisingly little genotypic difference. Then there is a second phase of growth reduction, which takes time to develop, and results from internal injury. The two-phase growth response is illustrated in Fig 4. The experiment was conducted with two genotypes with contrasting rates of Na+ uptake, and known differences in salt tolerance; previous experiments had shown that the genotype with the low Na+ uptake rate had a higher survival of high salinity. Fig 4 shows that during the first 3-4 weeks after the soil was salinized, there was a large growth reduction in both genotypes. This is called the ‘Phase 1’ response, and is due to the osmotic effect of the salt. Then after 4 weeks, the genotypes separated; the one with the low Na+ uptake rate continued to grow, although still at a reduced rate compared to the controls in non-saline solution, but the one with the high Na+ uptake rate produced little biomass and many individuals died. This is the ‘Phase 2’ response, and is due to genotypic differences in coping with the Na+ or Cl– ions in the soil, as distinct from the osmotic stress.
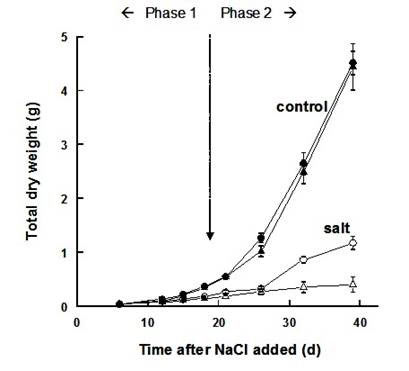
These results illustrate the principle that the initial growth reduction is due to the osmotic effect of the salt outside the roots, and that what distinguishes a salt-sensitive plant from a more tolerant one is the inability to prevent salt from reaching toxic levels in the transpiring leaves, which takes time.
To grow in saline conditions, plants must maintain a high water status in the face of soil water deficits and potential ion toxicity. A plant can only grow or survive in a saline soil if it can both continue to take up water and exclude a large proportion of the salt in the soil solution.
The Required Extent of Salt Exclusion
Roots must exclude most of the Na+ and Cl– dissolved in the soil solution or the salt will gradually build up with time in the shoot and become so high that it kills it. To prevent salt building up with time in the shoot, roots should exclude 98% of the salt in the soil solution, allowing only 2% to be transported in the xylem to the shoots. This value of 2% can be calculated from the following equation:
The concentration at which NaCl accumulates in the shoot depends on the salt concentration in the soil solution, the percentage of salt taken up by roots, and the percentage of water retained in the leaves:
[NaCl]shoot = | [NaCl]soil x | % salt taken up | (Eqn. 1) |
Plants retain only about 2% of the water they transpire, ie they take up about 50 time more water from the soil than they retain in their shoot tissues. The percentage of transpired water that is retained in the shoot can be calculated from the product of the water use efficiency (wue; mass of shoot produced per mass of H2O transpired) and the shoot water content (wc; shoot H2O per shoot mass):
Water use efficiency (WUE) of plants growing at moderate evaporation demand are usually in the range of 3-6 mg g-1, the variation due to extremes of evaporative demand, rather than a peculiarity of the species. For a water use efficiency of 4 mg g-1 and a shoot H2O: DW ratio of 5:1, about 20 mg of water is retained in the shoot for every g of water transpired (Eqn. 2). That is, the shoot retains only 2% of the water transpired. In order to prevent the salt concentration in the shoot increasing above that in the soil, then only 2% of the salt should be allowed into the shoot, i.e. 98% should be excluded.
% water retained = wue x wc x 100 (Eqn. 2)
A soil salinity of 100 mM NaCl or 10 dS m-1 is about as high as most crops will tolerate without a significant reduction in growth or yield (see Figs. 2 and 3), and a concentration of 100 mM NaCl on a whole shoot basis is about as high as is desirable because it will include some old leaves with much higher salt concentrations, as well as younger leaves or other tissues with lower concentrations. So for plants to grow for extended periods of time in soils with salinity of this order of magnitude, roots should ensure that no more than 2% gets to the shoots. Roots themselves do not accumulate excessively high concentrations of salt. The Na+ and Cl– concentration in roots is rarely higher than in the external solution, and often is lower.
The Relationship between Transpiration and Salt Uptake
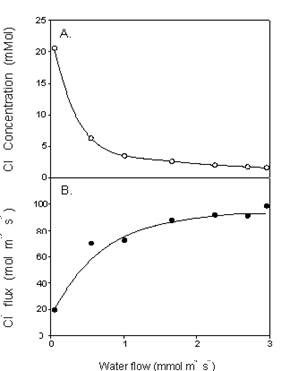
The fundamental processes governing the relationship between water and ion flow through roots are complex and not well understood. NaCl does not move passively with the transpiration stream, neither is its movement entirely independent of it, at least in some species, or over certain ranges of transpiration. Fig. 5 shows the relationship between water and salt flow in the xylem of barley plants (Munns, 1985). As water flow increased from a very low to a moderate rate, there was an increase in Cl– flux, showing that the movement of the ion through the root was enhanced as water flow started to increase. However, when the water flow increased from moderate to high rates, there was little or no further increase in Cl– flux, showing that the movement of the ion was independent of further increases in water flow. This relationship also holds for Na+ and K+.
Measurements of ion concentrations in leaves of most plants grown at different humidities are consistent with this pattern, that salt transport to leaves is substantially affected only if transpiration is greatly affected. An effect might be seen more with species that are very poor excluders, such as lupin as mentioned above, and rice, which carry much more salt in an apoplastic or transpirational “bypass” pathway than other species. In rice, the percentage of water moving through a bypass pathway from roots to shoots was estimated as 5.5% of the total water transpired, and could account for all the Na+ transported to the shoots, whereas in wheat only 0.4% of the water moved along a bypass pathway and could not account for most of the Na+ transported (Garcia et al., 1997).
Mechanisms of Control of Salt Transport
Here we look at differences between species in the ability to tolerate the salt-specific component of salinity. Differences in tolerating the osmotic stress itself are in common with drought tolerance.
The rate at which old leaves die depends on the rate at which salts accumulate to toxic levels. Thus, control of the rate at which salt arrives in leaves is essential, as are mechanisms that reduce the toxicity of the salt. For species lacking the ability to compartmentalise salts in the vacuoles to high concentrations (see below), continued transport of salt to the leaves will eventually result in either excessive build-up of salts in the cell walls or in the cytoplasm. The former will cause death through dehydration, and the latter will cause death through poisoning of metabolic systems such as photosynthesis or respiration.
Control at the whole plant level
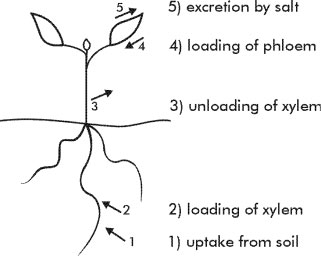
Control of salt transport into and through the plant takes place at five sites in the plant (Fig. 6). Control occurs in the root cortex, at the loading of the xylem, at the retrieval from the xylem in upper parts of the roots. These three processes serve to reduce the transport to the leaves. Control in the shoot occurs by the exclusion of salt from the phloem sap flowing to meristematic regions of the shoot. An additional mechanism occurs in most halophytes: specialised cells to excrete salt from leaves. However, halophytes also rely on the first four mechanisms to reduce the flux of salt to the leaves – excretion is an additional backup for plants growing in very saline site, and for perennial species.
Exclusion is particularly important for perennial species whose leaves may live for a year or more. For these species there is greater need to regulate the incoming salt load than for annual species whose leaves may live for only one month.
There are contributory features that function to maintain low rates of salt accumulation in leaves. High shoot/root ratios and high intrinsic growth rates (Pitman, 1984), and absence of an apoplastic pathway in roots (Garcia et al., 1997) all will serve to reduce the rate at which salt enters the transpiration stream and accumulates in the shoot.
Ion concentration in shoot (mol g-1) = Ion uptake rate (mol g-1d-1) (Eqn 3)
Relative growth rate (g g-1 d-1)
Two principles emerge from this equation. First, a fast-growing plant will have a lower concentration in the shoot than a slow growing plant, for the same uptake rate. Note that it is the relative growth rate (RGR) not the size itself that influences the ion concentration in the shoot. The notion of ‘vigour’ as affecting ion concentration therefore needs to be defined carefully, as RGR is independent of plant size. Second, any increase in shoot ion concentration with increasing salinity may not be due to increase ion uptake rate – it could be due to decreased RGR due to the osmotic effect of the salt. This also means that an additional stress such as waterlogging that depress RGR will also cause an increase in concentration in the shoot for the same uptake rate
Control at the cellular level: ion compartmentation
There is no evidence of adaptations in enzymes to the presence of salt, so mechanisms for salt tolerance at the cellular level involve keeping the salt out of the cytoplasm, and sequestering it in the vacuole. That this occurs in most species is indicated by the high concentrations found in leaves that are still functioning normally, concentrations well over 200 mM, which are known to completely repress enzyme activity in vitro (Munns, 2002) Generally, Na+ starts to inhibit most enzymes at a concentration above 100 mM. The concentration at which Cl– becomes toxic is even less well defined, but is probably in the same range as that for Na+. If Na+ and Cl– are sequestered in the vacuole of the cell, K+ and organic solutes should accumulate in the cytoplasm and
organelles to balance the osmotic pressure of the ions in the vacuole. The organic solutes that accumulate most commonly under salinity are proline and glycinebetaine, although other molecules can accumulate to lesser degrees.
Salt tolerant species have transport systems on the tonoplast that can sequester Na+ and Cl– at high concentrations within the vacuoles, while maintaining much lower concentrations in the cytoplasmic compartments. The ion channels and transporters that regulate the net movement of salt across cell membranes were described in several recent reviews (see under Salinity Stress).
In summary, roots do most of the work in protecting the plant from excessive uptake of salts, and filter out most of the salt in the soil while taking up water. Even so, there are mechanisms for coping with the continuous delivery of relatively small amounts of salt that arrive in the leaves, the most important being the cellular compartmentalisation of salts in the vacuoles of the mesophyll cells. This strategy allows plants to minimize or delay the toxic effects of high concentrations of ions on important and sensitive cytoplasmic processes. The rate at which leaves die is the rate at which salts accumulate to toxic levels, so genotypes that have poor control of the rate at which salt arrives in leaves, or a poor ability to sequester that salt in cell vacuoles, have a greater rate of leaf death.
Publications cited
Garcia A, Rizzo C.A., Ud-Din J., Bartos S.L., Senadhira D., Flowers T.J., Yeo A.R. 1997. Sodium and potassium transport to the xylem are inherited independently in rice, and the mechanism of sodium:potassium selectivity differs between rice and wheat. Plant Cell Environ. 20:1167-1174.
Ghassemi F., Jakeman A.J., Nix H.A. 1995. Salinisation of land and water resources: Human causes, extent, management and case studies. UNSW Press, Sydney, Australia, and CAB International, Wallingford, UK.
Greenway H., Munns R. 1980. Mechanisms of salt tolerance in nonhalophytes. Annu. Rev. Plant Physiol. 31:149-190.
Munns, R. 1985. Na+, K+ and C1- Xylem sap flowing to shoots of NaCl-treated barley. J. Exp. Bot. 36:1032-1042.
Munns R. 1993. Physiological processes limiting plant growth in saline soil: some dogmas and hypotheses. Plant Cell Environ. 16:15-24.
Munns R (2002) Comparative physiology of salt and water stress. Plant Cell Environ. 25, 239-250.
Munns. R., Schachtman D.P. Condon A.G. 1995). The significance of a two-phase growth response to salinity in wheat and barley. Aust. J. Plant Physiol. 22:561-569.
Munns, R., Husain, S..Rivelli, A.R James, R.A. Condon, A.G. (Tony) Lindsay, M.P. Lagudah, E.S. Schachtman, D.P. Hare R.A. 2002. Avenues for increasing salt tolerance of crops, and the role of physiologically based selection traits. Plant and Soil 247:93-105).
Rengasamy P 2002. Transient salinity and subsoil constraints to dryland farming in Australian sodic soils: an overview. Aust. J. Exp. Agric. 42:351-361.